Market Trends and Statistics October 15, 2018

South King County Market Trends

In September, the average days on market landed at 26 days and the original list-to-sale price ratio 98%. Since May, inventory growth has been noticeable, and has given buyers more options. This has led to more negotiations and fewer bidding wars, which is tempering month-over-month price growth to a more sustainable level. Back in April, the average days on market was 21 days and the original list-to-sale price ratio 103%; but months of inventory based on pending sales was 0.9 months, compared to 2.6 months currently. Year-over-year, prices are up 10%, still well above the historical norm of 3%-5% year-over-year gains—but note that the majority of this growth happened during the spring, due to constricted inventory levels.

Supply has increased, creating more options for buyers and helping to buffer affordability issues. Many sellers are deciding to make moves and cash in on the equity gained over the last six years. An average original list-to-sale price ratio of 98% is a positive return, yet illustrates a softening in the market after some very extreme times. With 10% price growth over the last 12-months in a seller’s favor, the increase in selection has led to more nimble moves from one house to another. Where sellers need to be careful is anticipating the month-over-month price growth we saw prior to the shift in inventory. Prospective buyers would be smart to take advantage of today’s historically low interest rates and the added inventory selection.

This is only a snapshot of the trends in south King County; please contact me if you would like further explanation of how the latest trends relate to you.

Market Trends and Statistics October 15, 2018

Eastside Quarterly Market Trends

In September, the average days on market landed at 32 days and the original list-to-sale price ratio 98%. Since May, inventory growth has been noticeable, and has given buyers more options. This has led to more negotiations and fewer bidding wars, which is tempering month-over-month price growth to a more sustainable level. Back in April, the average days on market was 13 days and the original list-to-sale price ratio 103%; but months of inventory based on pending sales was 0.8 months, compared to 2.9 months currently. Year-over-year, prices are up 10%, still well above the historical norm of 3%-5% year-over-year gains—but note that the majority of this growth happened during the spring, due to constricted inventory levels.

Supply has increased, creating more options for buyers and helping to buffer affordability issues. Many sellers are deciding to make moves and cash in on the equity gained over the last six years. An average original list-to-sale price ratio of 98% is a positive return, yet illustrates a softening in the market after some very extreme times. With 10% price growth over the last 12-months in a seller’s favor, the increase in selection has led to more nimble moves from one house to another. Where sellers need to be careful is anticipating the month-over-month price growth we saw prior to the shift in inventory. Prospective buyers would be smart to take advantage of today’s historically low interest rates and the added inventory selection.

This is only a snapshot of the trends on the Eastside; please contact me if you would like further explanation of how the latest trends relate to you.

Market Trends and Statistics October 15, 2018

Seattle Metro Quarterly Market Trends

In September, the average days on market landed at 23 days and the original list-to-sale price ratio 98%. Since May, inventory growth has been noticeable, and has given buyers more options. This has led to more negotiations and fewer bidding wars, which is tempering month-over-month price growth to a more sustainable level. Back in April, the average days on market was 11 days and the original list-to-sale price ratio 105%; but months of inventory based on pending sales was 0.8 months, compared to 2.4 months currently. Year-over-year, prices are up 11%, still well above the historical norm of 3%-5% year-over-year gains—but note that the majority of this growth happened during the spring, due to constricted inventory levels.

Supply has increased, creating more options for buyers and helping to buffer affordability issues. Many sellers are deciding to make moves and cash in on the equity gained over the last six years. An average original list-to-sale price ratio of 98% is a positive return, yet illustrates a softening in the market after some very extreme times. With 10% price growth over the last 12-months in a seller’s favor, the increase in selection has led to more nimble moves from one house to another. Where sellers need to be careful is anticipating the month-over-month price growth we saw prior to the shift in inventory. Prospective buyers would be smart to take advantage of today’s historically low interest rates and the added inventory selection.

This is only a snapshot of the trends in the Seattle Metro area; please contact me if you would like further explanation of how the latest trends relate to you.

Market Trends and Statistics October 15, 2018

North King County Quarterly Market Trends

In September, the average days on market landed at 23 days and the original list-to-sale price ratio 98%. Since May, inventory growth has been noticeable, and has given buyers more options. This has led to more negotiations and fewer bidding wars, which is tempering month-over-month price growth to a more sustainable level. Back in April, the average days on market was 12 days and the original list-to-sale price ratio 106%; but months of inventory based on pending sales was 0.8 months, compared to 2.2 months currently. Year-over-year, prices are up 10%, still well above the historical norm of 3%-5% year-over-year gains—but note that the majority of this growth happened during the spring, due to constricted inventory levels.

Supply has increased, creating more options for buyers and helping to buffer affordability issues. Many sellers are deciding to make moves and cash in on the equity gained over the last six years. An average original list-to-sale price ratio of 98% is a positive return, yet illustrates a softening in the market after some very extreme times. With 10% price growth over the last 12-months in a seller’s favor, the increase in selection has led to more nimble moves from one house to another. Where sellers need to be careful is anticipating the month-over-month price growth we saw prior to the shift in inventory. Prospective buyers would be smart to take advantage of today’s historically low interest rates and the added inventory selection.

This is only a snapshot of the trends in north King County; please contact me if you would like further explanation of how the latest trends relate to you.

Market Trends and Statistics October 15, 2018

South Snohomish County Quarterly Market Trends

In September, the average days on market landed at 27 days and the original list-to-sale price ratio 98%. Since May, inventory growth has been noticeable, and has given buyers more options. This has led to more negotiations and fewer bidding wars, which is tempering month-over-month price growth to a more sustainable level. Back in April, the average days on market was 14 days and the original list-to-sale price ratio 104%; but months of inventory based on pending sales was 0.8 months, compared to 2.5 months currently. Year-over-year, prices are up 11%, still well above the historical norm of 3%-5% year-over-year gains—but note that the majority of this growth happened during the spring, due to constricted inventory levels.

Supply has increased, creating more options for buyers and helping to buffer affordability issues. Many sellers are deciding to make moves and cash in on the equity gained over the last six years. An average original list-to-sale price ratio of 98% is a positive return, yet illustrates a softening in the market after some very extreme times. With 11% price growth over the last 12-months in a seller’s favor, the increase in selection has led to more nimble moves from one house to another. Where sellers need to be careful is anticipating the month-over-month price growth we saw prior to the shift in inventory. Prospective buyers would be smart to take advantage of today’s historically low interest rates and the added inventory selection.

This is only a snapshot of the trends in south Snohomish County; please contact me if you would like further explanation of how the latest trends relate to you.

Market Trends and Statistics October 15, 2018

North Snohomish County Quarterly Market Trends

In September, the average days on market landed at 29 days and the original list-to-sale price ratio at 98%. Since May, inventory growth has been noticeable, and has given buyers more options. This has led to more negotiations and fewer bidding wars, which is tempering month-over-month price growth to a more sustainable level. Back in May, the average days on market was 22 days and the original list-to-sale price ratio 101%; but months of inventory based on pending sales was 1 month compared to 2.3 months currently. Year-over-year, prices are up 11%, still well above the historical norm of 3%-5% year-over-year gains—but note that the majority of this growth happened during the spring, due to constricted inventory levels.

Supply has increased, creating more options for buyers and helping to buffer affordability issues. Many sellers are deciding to make moves and cash in on the equity gained over the last six years. An average original list-to-sale price ratio of 98% is a positive return, yet illustrates a softening in the market after some very extreme times. With 11% price growth over the last 12-months in a seller’s favor, the increase in selection has led to more nimble moves from one house to another. Where sellers need to be careful is anticipating the month-over-month price growth we saw prior to the shift in inventory. Prospective buyers would be smart to take advantage of today’s historically low interest rates and the added inventory selection.

This is only a snapshot of the trends in north Snohomish County; please contact me if you would like further explanation of how the latest trends relate to you.

Market Trends and Statistics April 30, 2018

Does it make more sense to rent or own?

The current break-even horizon* in the Seattle metro area is 1.6 years!

*The amount of time you need to own your home in order for owning to be a superior financial decision.

With rising rental rates, historically low interest rates, and home prices on the rise, the advantage of buying vs. renting is becoming clearer each month.

In fact, Seattle has seen some of the sharpest rent hikes in the country over the last year! Snohomish County has seen a huge increase in apartment growth and rising rental rates as well. There are several factors to consider that will lead you to make the best decision for your lifestyle and your financial bottom line. Zillow Research has determined the break-even point for renting vs. buying in our metro area. In other words, the amount of time you need to own your home in order for owning to be a superior financial decision. Currently in Seattle the break-even point is 1.6 years – that is quick! What is so great about every month that ticks away thereafter is that your nest egg is building in value.

I am happy to help you or someone you know assess your options; please contact me anytime.

These assumptions are based on a home buyer purchasing a home with a 30-year, fixed-rate mortgage and a 20 percent down payment; and a renter earning five percent annually on investments in the stock market.

Matthew Gardner Economic Reports April 25, 2018

Western Washington Real Estate Market Update – First Quarter 2018


The following analysis of the Western Washington real estate market is provided by Windermere Real Estate Chief Economist Matthew Gardner. We hope that this information may assist you with making better-informed real estate decisions. For further information about the housing market in your area, please don’t hesitate to contact me.

ECONOMIC OVERVIEW

The Washington State economy added 96,900 new jobs over the past 12 months, representing an annual growth rate of 2.9%—still solidly above the national rate of 1.5%. Most of the employment gains were in the private sector, which rose by 3.4%. The public sector saw a more modest increase of 1.6%.

The strongest growth was in the Education & Health Services and Retail sectors, which added 17,300 and 16,700 jobs, respectively. The Construction sector added 10,900 new positions over the past 12 months.

Even with solid increases in jobs, the state unemployment rate held steady at 4.7%—a figure that has not moved since September of last year.

I expect the Washington State economy to continue adding jobs in 2018, but not at the same rate as last year given that we are nearing full employment. That said, we will still outperform the nation as a whole when it comes to job creation.

HOME SALES ACTIVITY

  • There were 14,961 home sales during the first quarter of 2018. This is a drop of 5.4% over the same period in 2017.
  • Clallam County saw sales rise the fastest relative to the first quarter of 2017, with an increase of 16.5%. In most of the other markets, the lack of available homes for sale slowed the number of closings during this period.
  • Listing inventory in the quarter was down by 17.6% when compared to the first quarter of 2017, but pending home sales rose by 2.6% over the same period, suggesting that closings in the second quarter should be fairly robust.
  • The takeaway from this data is that the lack of supply continues to put a damper on sales. I also believe that the rise in interest rates in the finalquarter of 2017 likely pulled sales forward, leading to a drop in sales in the first quarter of 2018.


HOME PRICES

  • With ongoing limited inventory, it’s not surprising that the growth in home prices continues to trend well above the long-term average. Year-over-year, average prices rose 14.4% to $468,312.
  • Economic vitality in the region is leading to robust housing demand that far exceeds supply. Given the relative lack of new construction homes— something that is unlikely to change any time soon—there will continue to be pressure on the resale market. As a result, home prices will continue to rise at above-average rates in the coming year.
  • When compared to the same period a year ago, price growth was strongest in Grays Harbor County at 27.5%. Ten additional counties experienced double-digit price growth.
  • Mortgage rates continued to rise during first quarter, and are expected to increase modestly in the coming months. By the end of the year, interest rates will likely land around 4.9%, which should take some of the steam out of price growth. This is actually a good thing and should help address the challenges we face with housing affordability—especially in markets near the major job centers.


DAYS ON MARKET

  • The average number of days it took to sell a home dropped by seven days when compared to the same quarter of 2017.
  • King County continues to be the tightest market in Western Washington, with homes taking an average of 24 days to sell. Every county in the region saw the length of time it took to sell a home either drop or remain essentially static relative to the same period a year ago.
  • In looking at the entire region, it took an average of 61 days to sell a home in the first quarter of this year. This is down from 68 days in the firstquarter of 2017 but up by eleven days when compared to the fourth quarter of 2017.
  • Anyone expecting to see a rapid rise in the number of homes for sale in 2018 will likely be disappointed. New construction permit activity—a leading indicator—remains well below historic levels and this will continue to put increasing pressure on the resale home market.


CONCLUSIONS

This speedometer reflects the state of the region’s housing market using housing inventory, price gains, home sales, interest rates, and larger economic factors. For the first quarter of 2018, I have left the needle at the same point as fourth quarter of last year. Price growth remains strong even as sales activity slowed. All things being equal, 2018 is setting itself up to be another very good year for sellers but, unfortunately, not for buyers who will still see stiff competition for the limited number of available homes for sale.


Mr. Gardner is the Chief Economist for Windermere Real Estate, specializing in residential market analysis, commercial/industrial market analysis, financial analysis, and land use and regional economics. He is the former Principal of Gardner Economics, and has more than 30 years of professional experience both in the U.S. and U.K.

Lake Forest ParkNeighborhood Profiles November 2, 2017

Lake Forest Park

Welcome to Lake Forest Park!

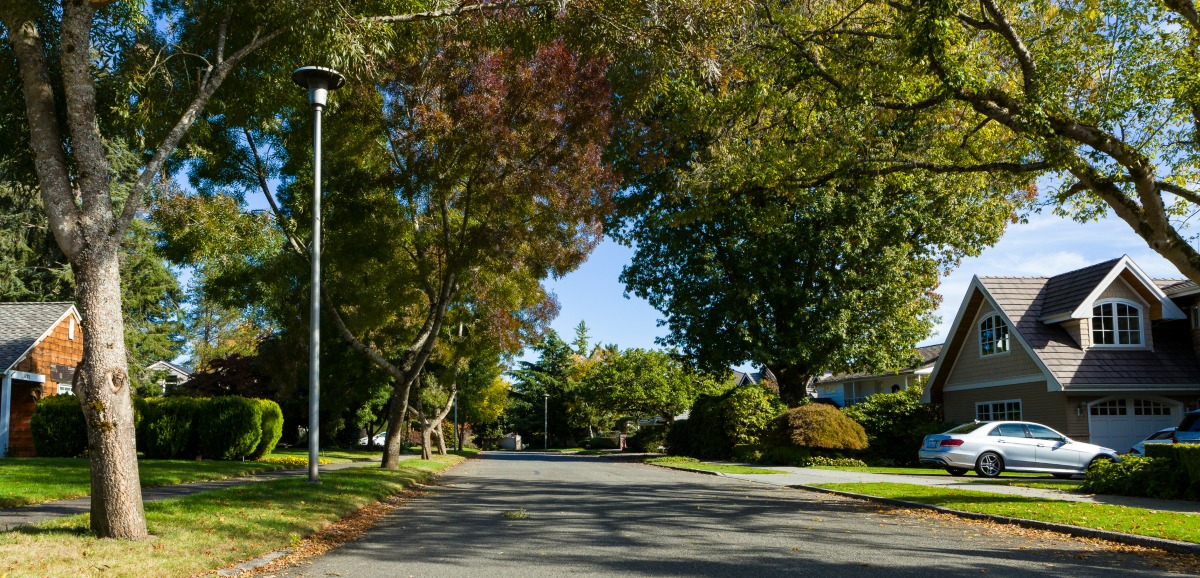
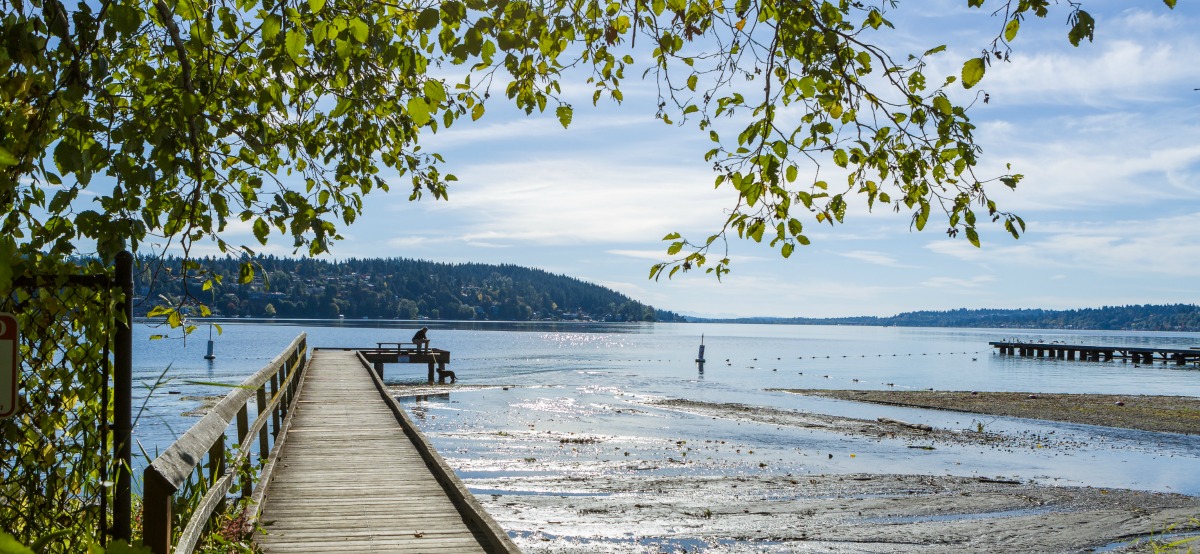
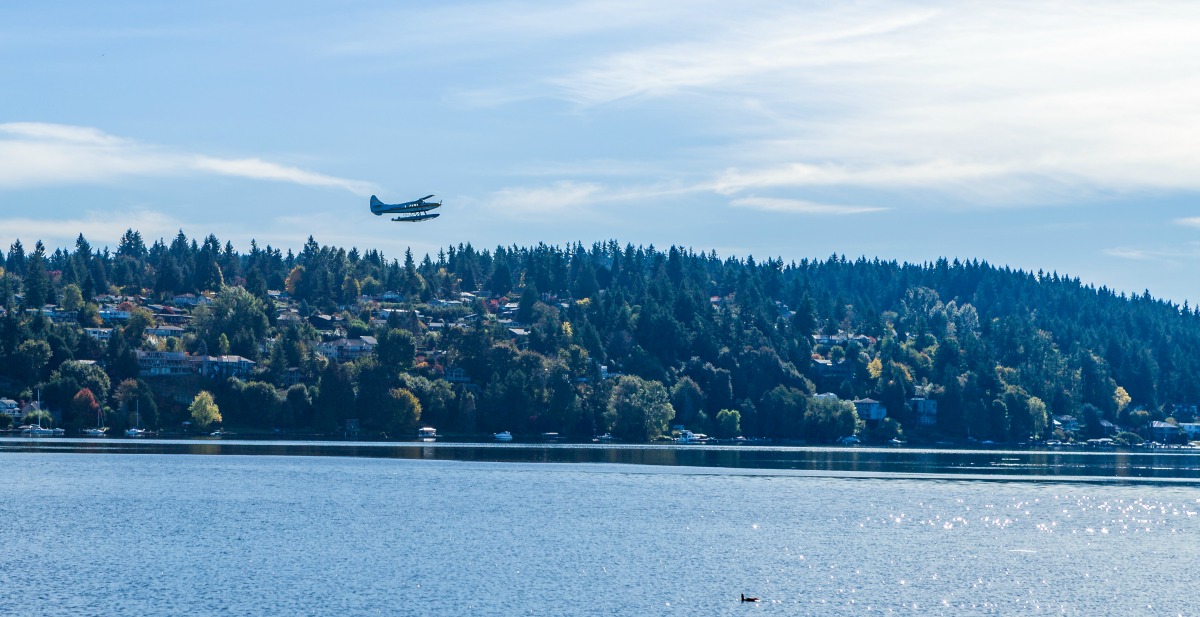
For those who love the great outdoors without being too far from premium city amenities, Lake Forest Park  is a dream come true! Nestled along the shores of picturesque Lake Washington and north of Seattle and Bellevue, Lake Forest Park offers the opportunity to truly have it all. Whether you need to commute into the city for work or want to spend a day on the beach, it’s all wonderfully within reach.

As Jill L points out, living in Lake Forest Park is “like being in an enchanted forest.” She adds that large lots cater to gardeners, and there’s even an amazing Garden Club you can join. Claudette M shares that “Most homes are on large lots, many along streams or creeks. The many trees that are the city’s namesake provide an immense amount of privacy between neighbors.” Keep exploring our guide to Lake Forest Park to see why people love this city! 


Getting Out & About

One of the coveted perks of owning in certain Lake Forest Park neighborhoods (there are quite a few that qualify) is eligibility for membership in the Lake Forest Park Civic Club. Members play on the shores of Lake Washington, enjoying access to the private beach/swim area and boat launch.

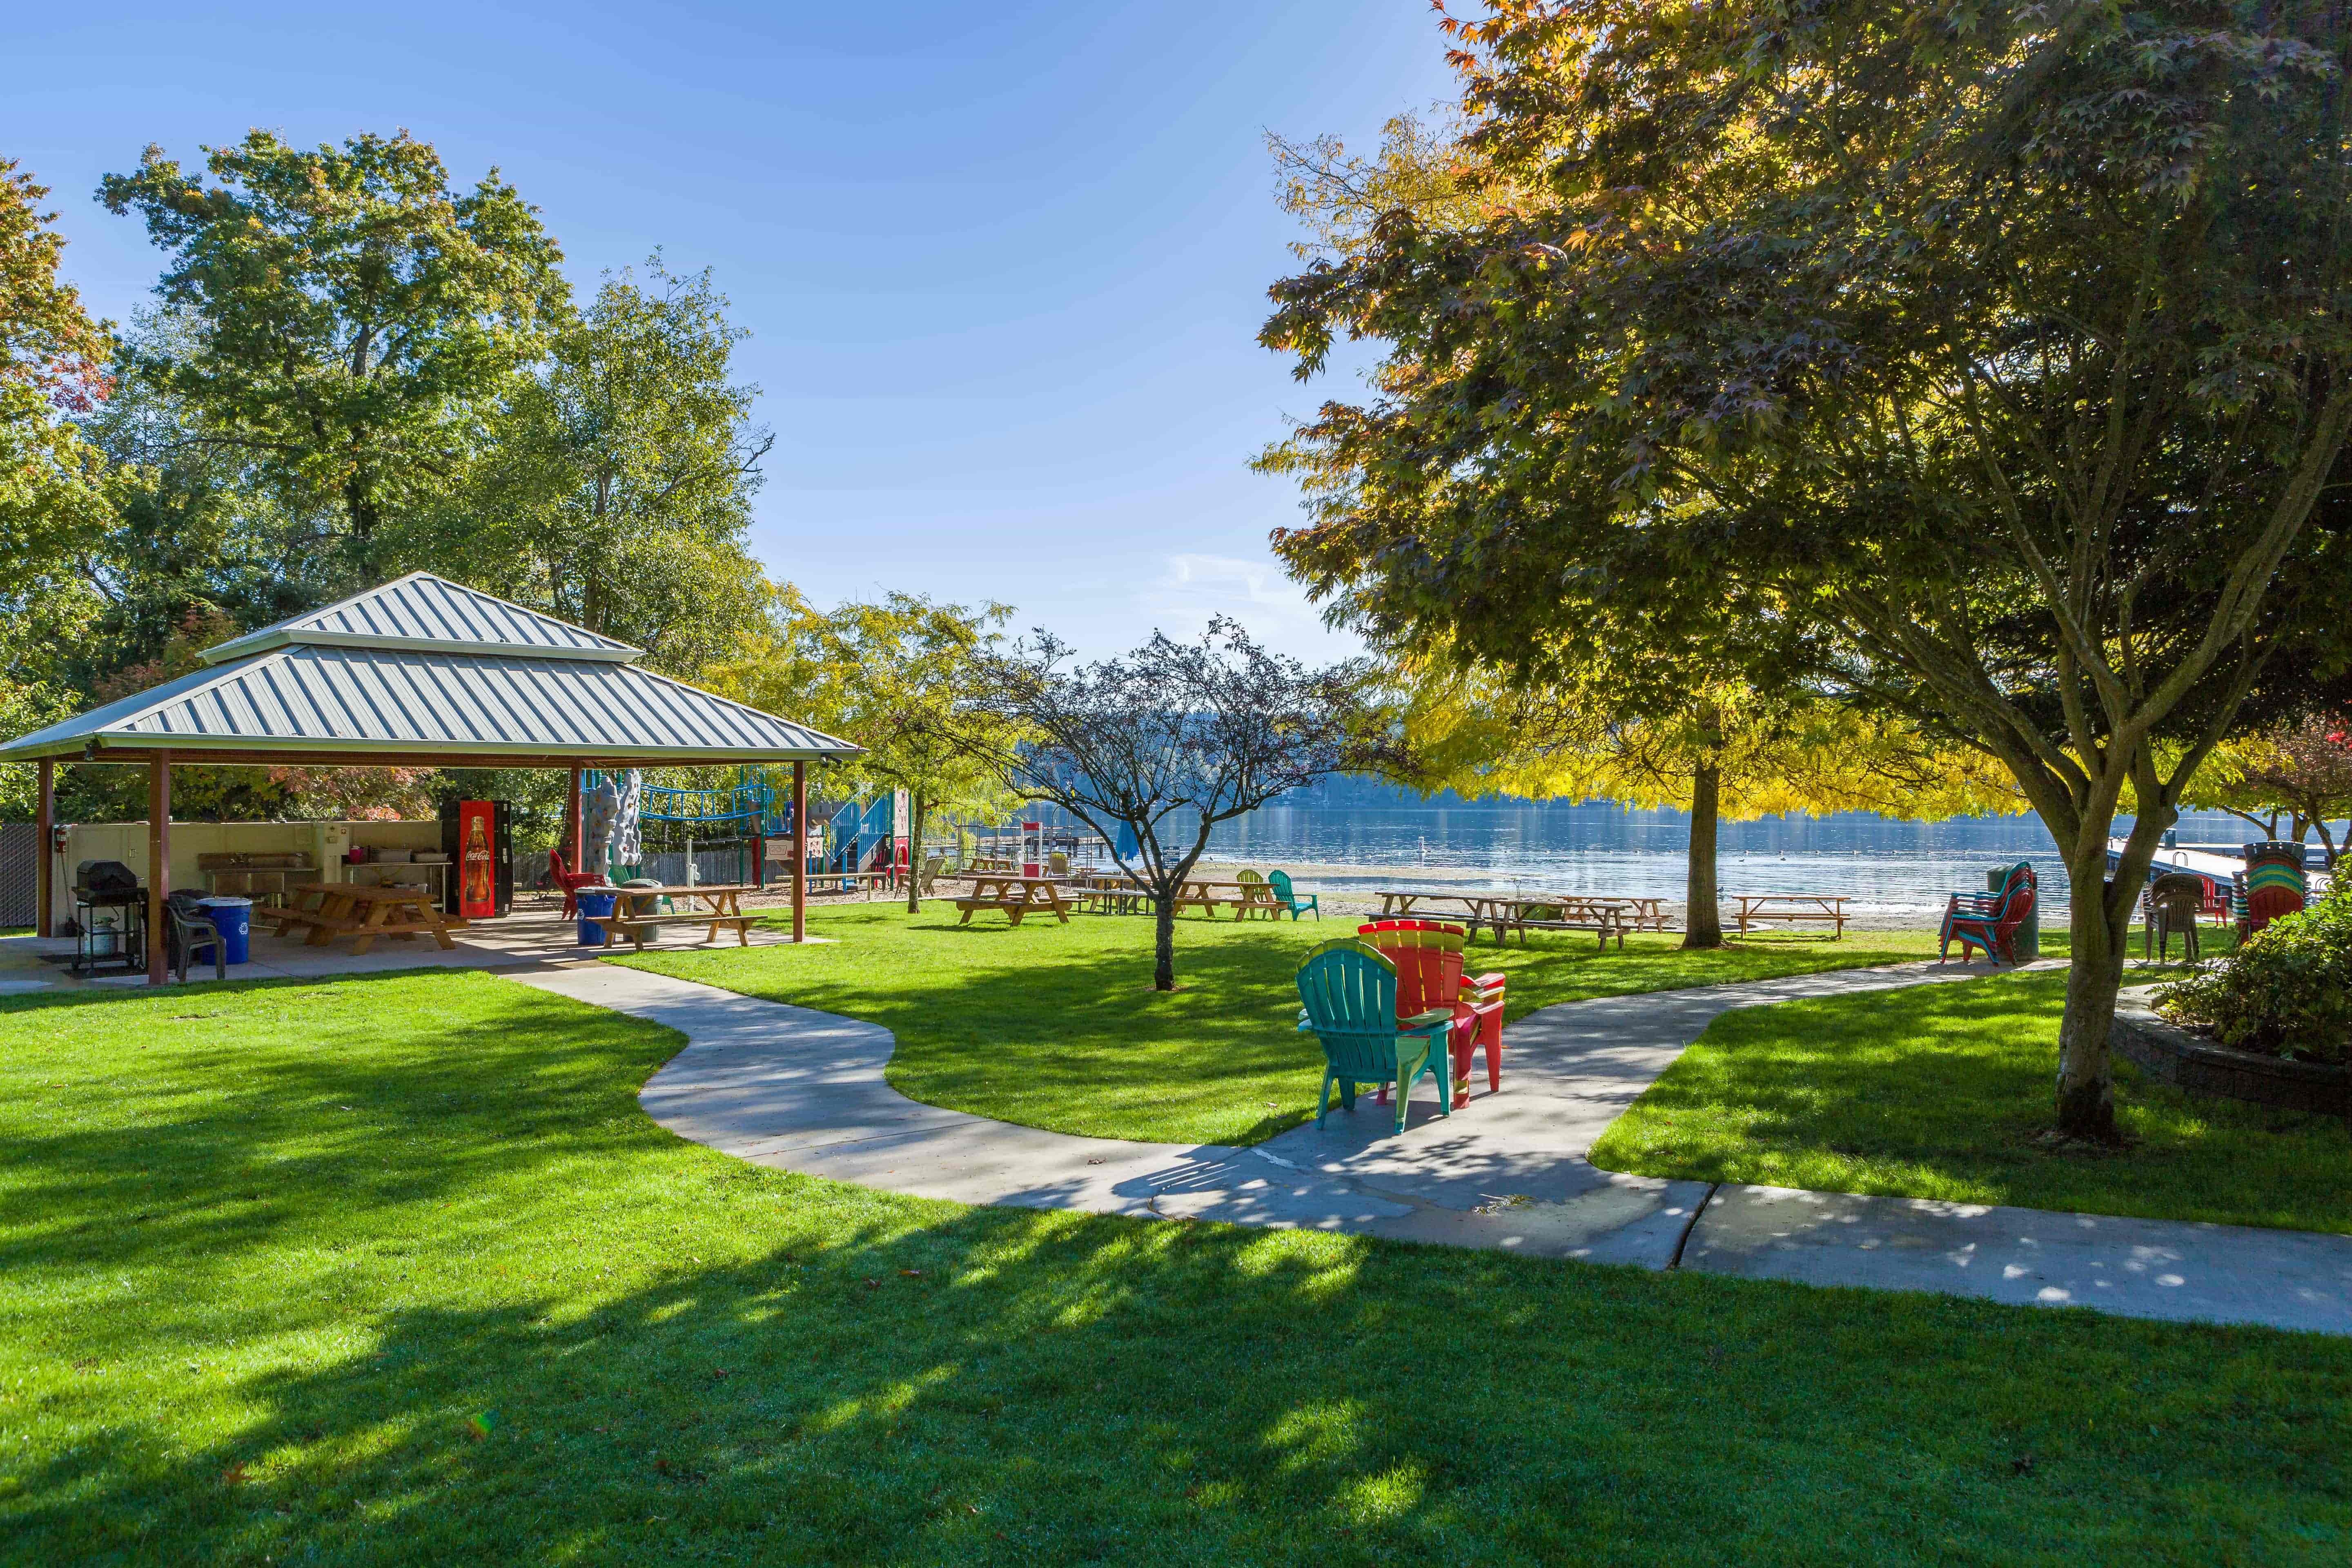
The Civic Club is well known with plenty of surrounding homes being deeded in, but lesser known is the adjacent Sheridan Beach Club which provides excellent amenities, shore access, a pool and most importantly, a heightened sense of community. If you’re looking for it all in LFP, the Beach Club is where you should start.

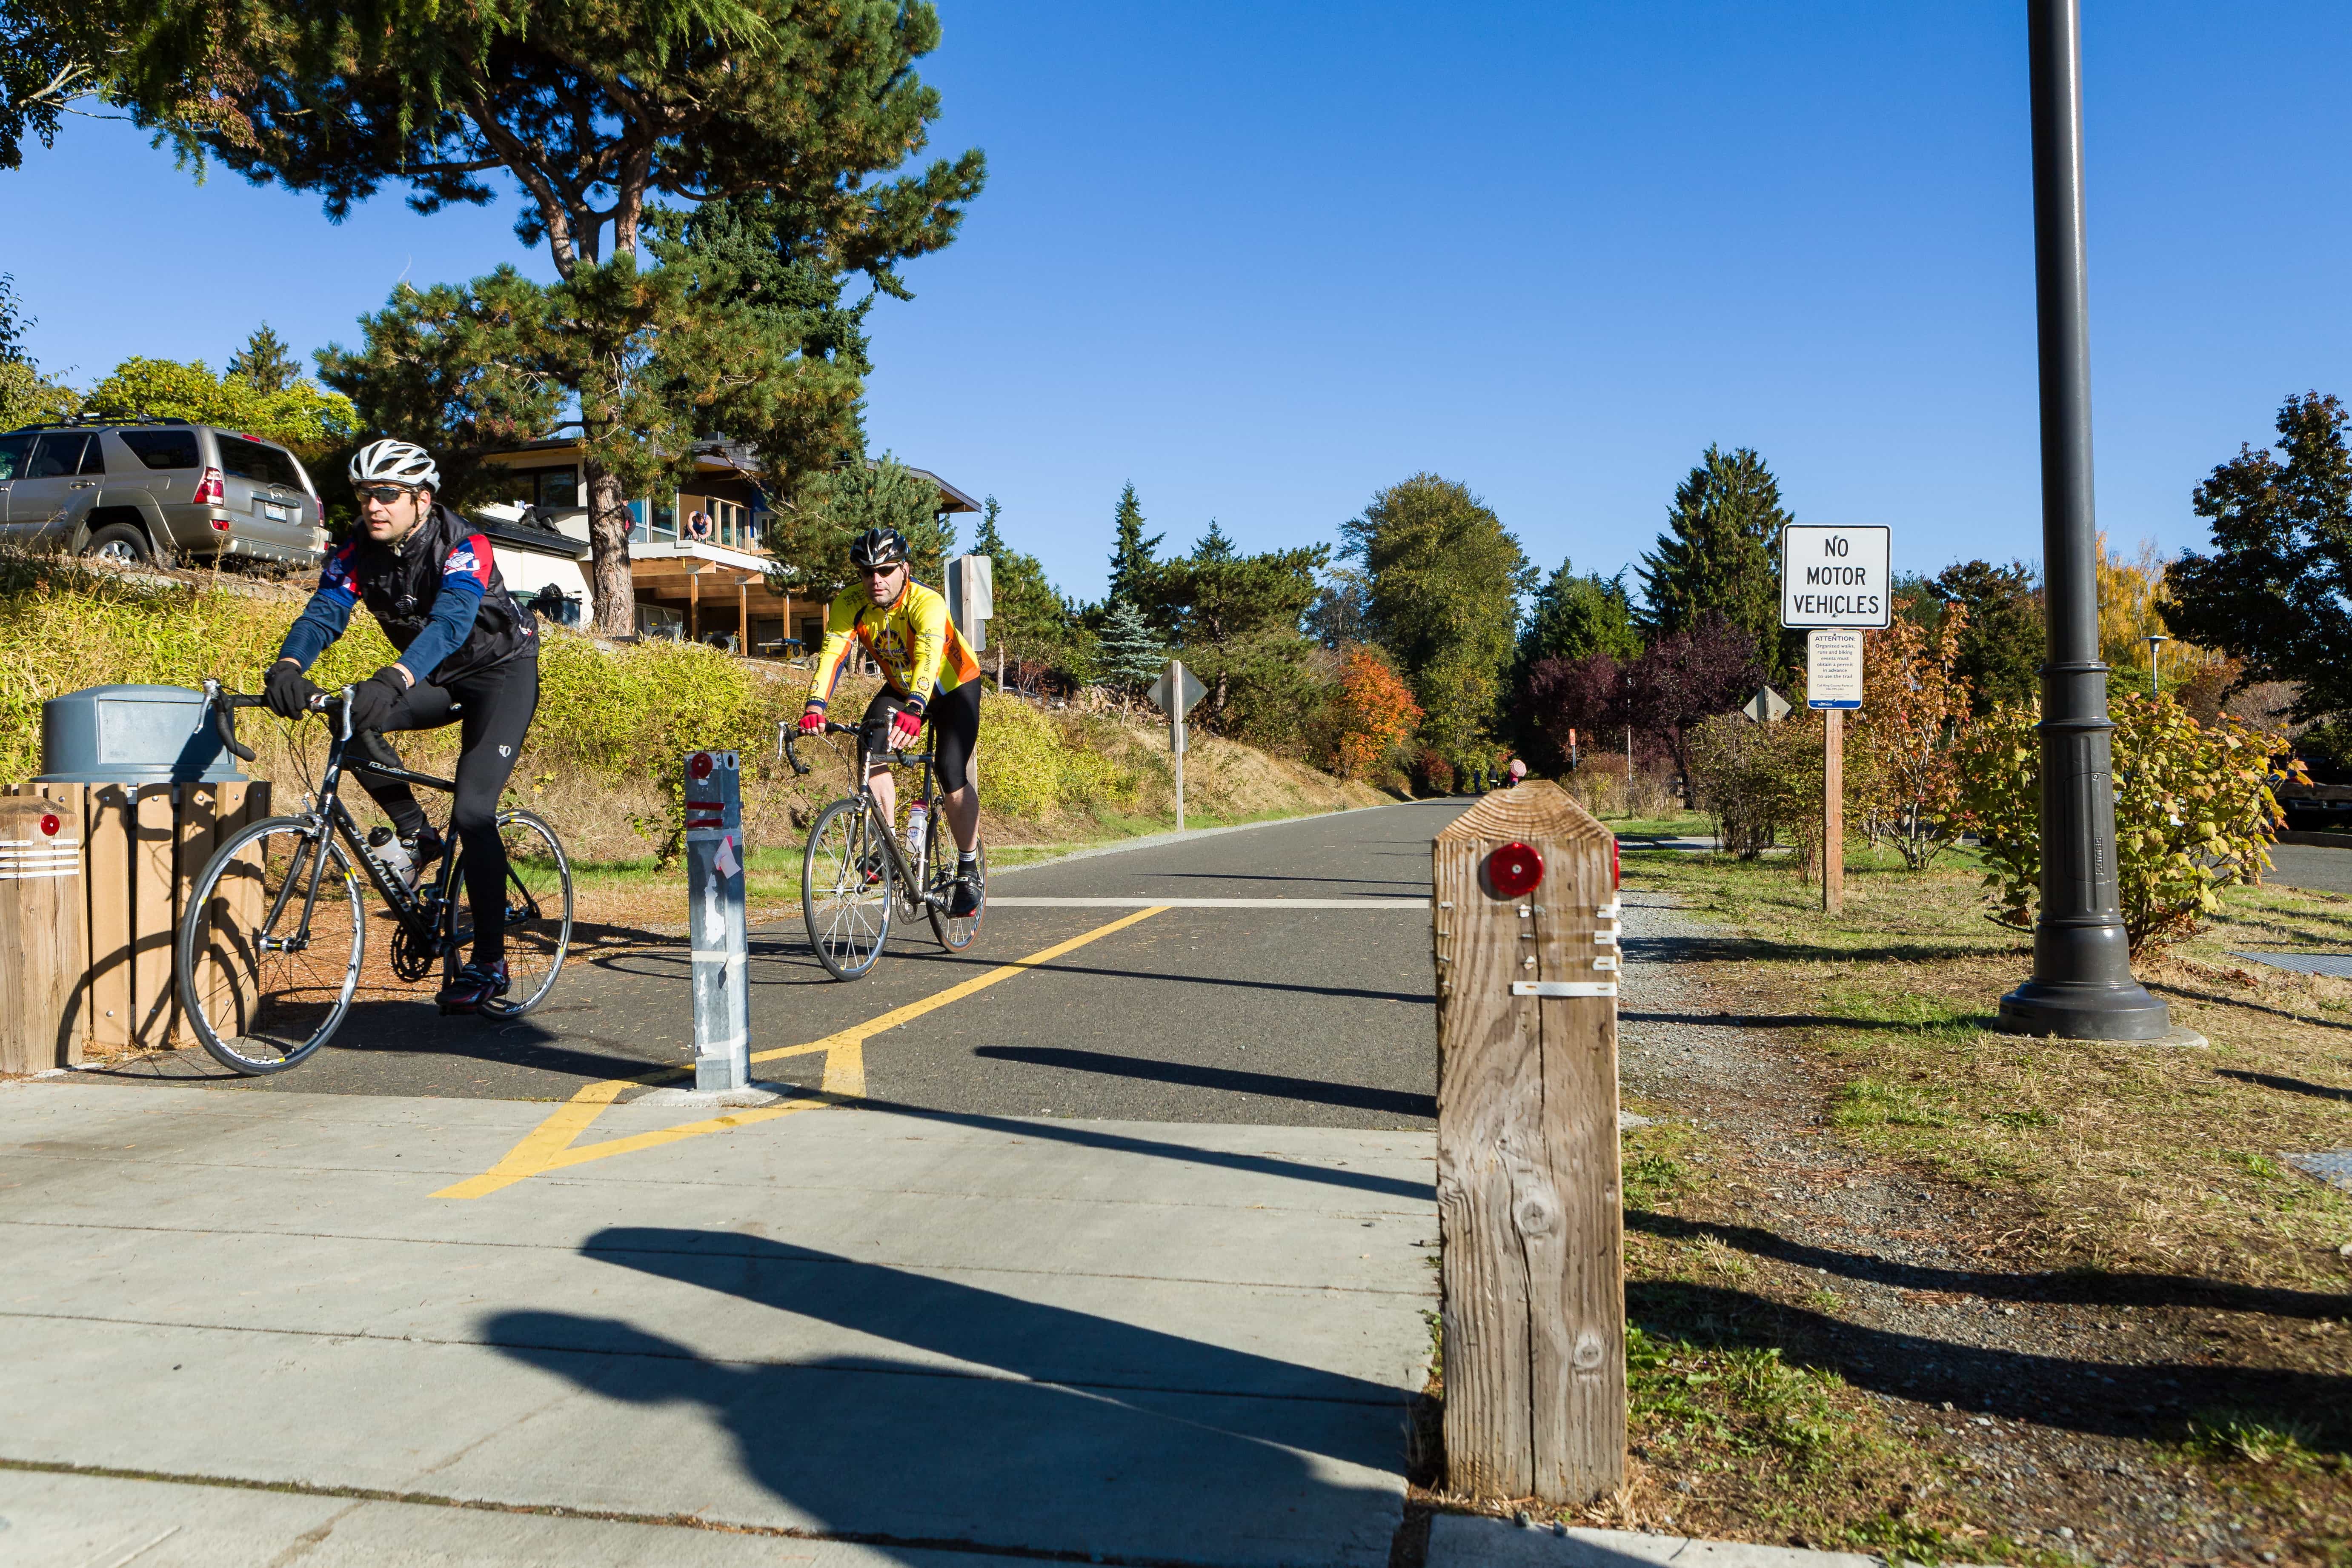
Go for a run, walk or bicycle ride on the Burke-Gilman Trail, along the shore of Lake Washington.

The Lake Forest Park Farmer’s market on Sundays is awesome.


Commuting From Lake Forest Park

Lake Forest Park residents predominantly rely on car & bus for their commutes to Seattle or the Eastside. However, with convenient access to a 2-mile stretch of the Burke-Gilman Trail that passes through the city, there is a robust population of residents that commute into Seattle by bicycle, and particularly work centers such as the University of Washington & Children’s Hospital.


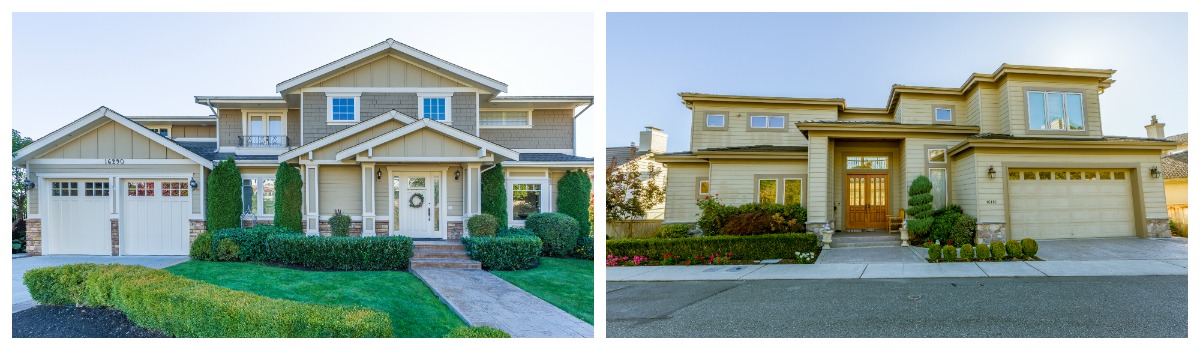
Homes in Lake Forest Park

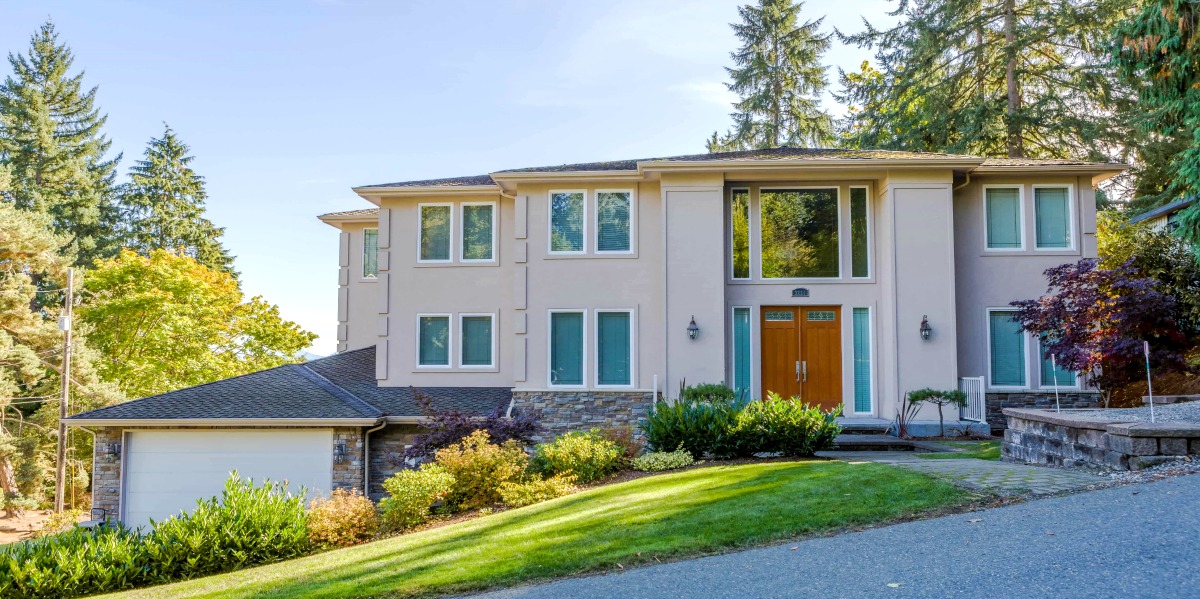
Lake Forest Park was designed as a bedroom community for Seattle, so much of the housing consists of single family homes built between the 1950s and early 1980s. The city is very hilly, so multi-level, split-entry and one-story with basement homes that accommodate the topography are common. The hilly topography also translates into many homes enjoying Cascade Mountain or verdant territorial views, and some with Lake Washington views too.

Matthew Gardner Economic Reports November 1, 2017

The Gardner Report – Third Quarter 2017

As a member of Windermere Real Estate, the leading real estate company in the Western U.S., I have access to a vast array of resources and services that are designed to help you make well-informed decisions regarding your real estate needs. This includes access to the most relevant housing and economic data from Windermere’s Chief Economist, Matthew Gardner.

Matthew has been a real estate economist for more than 25 years in both the U.S. and U.K. He specializes in residential market analysis, commercial/industrial market analysis, financial analysis, and land use and regional economics. His study and interpretation of this economic data and its impact on the real estate market, gives us unique insights into short-term and long-term housing trends that are important to consider when buying or selling a home.

Every quarter Matthew compiles a detailed report that analyzes the Western Washington real estate market.  Read the full Third Quarter Gardner Report here.  If this is something you’d like to personally receive every quarter, please contact me and I will add you to my distribution list. It is my goal to help keep my clients informed, empower strong decisions and create exceptional results.