
 Facebook
 X
X
 Pinterest
 Copy Link
South King County Market Trends
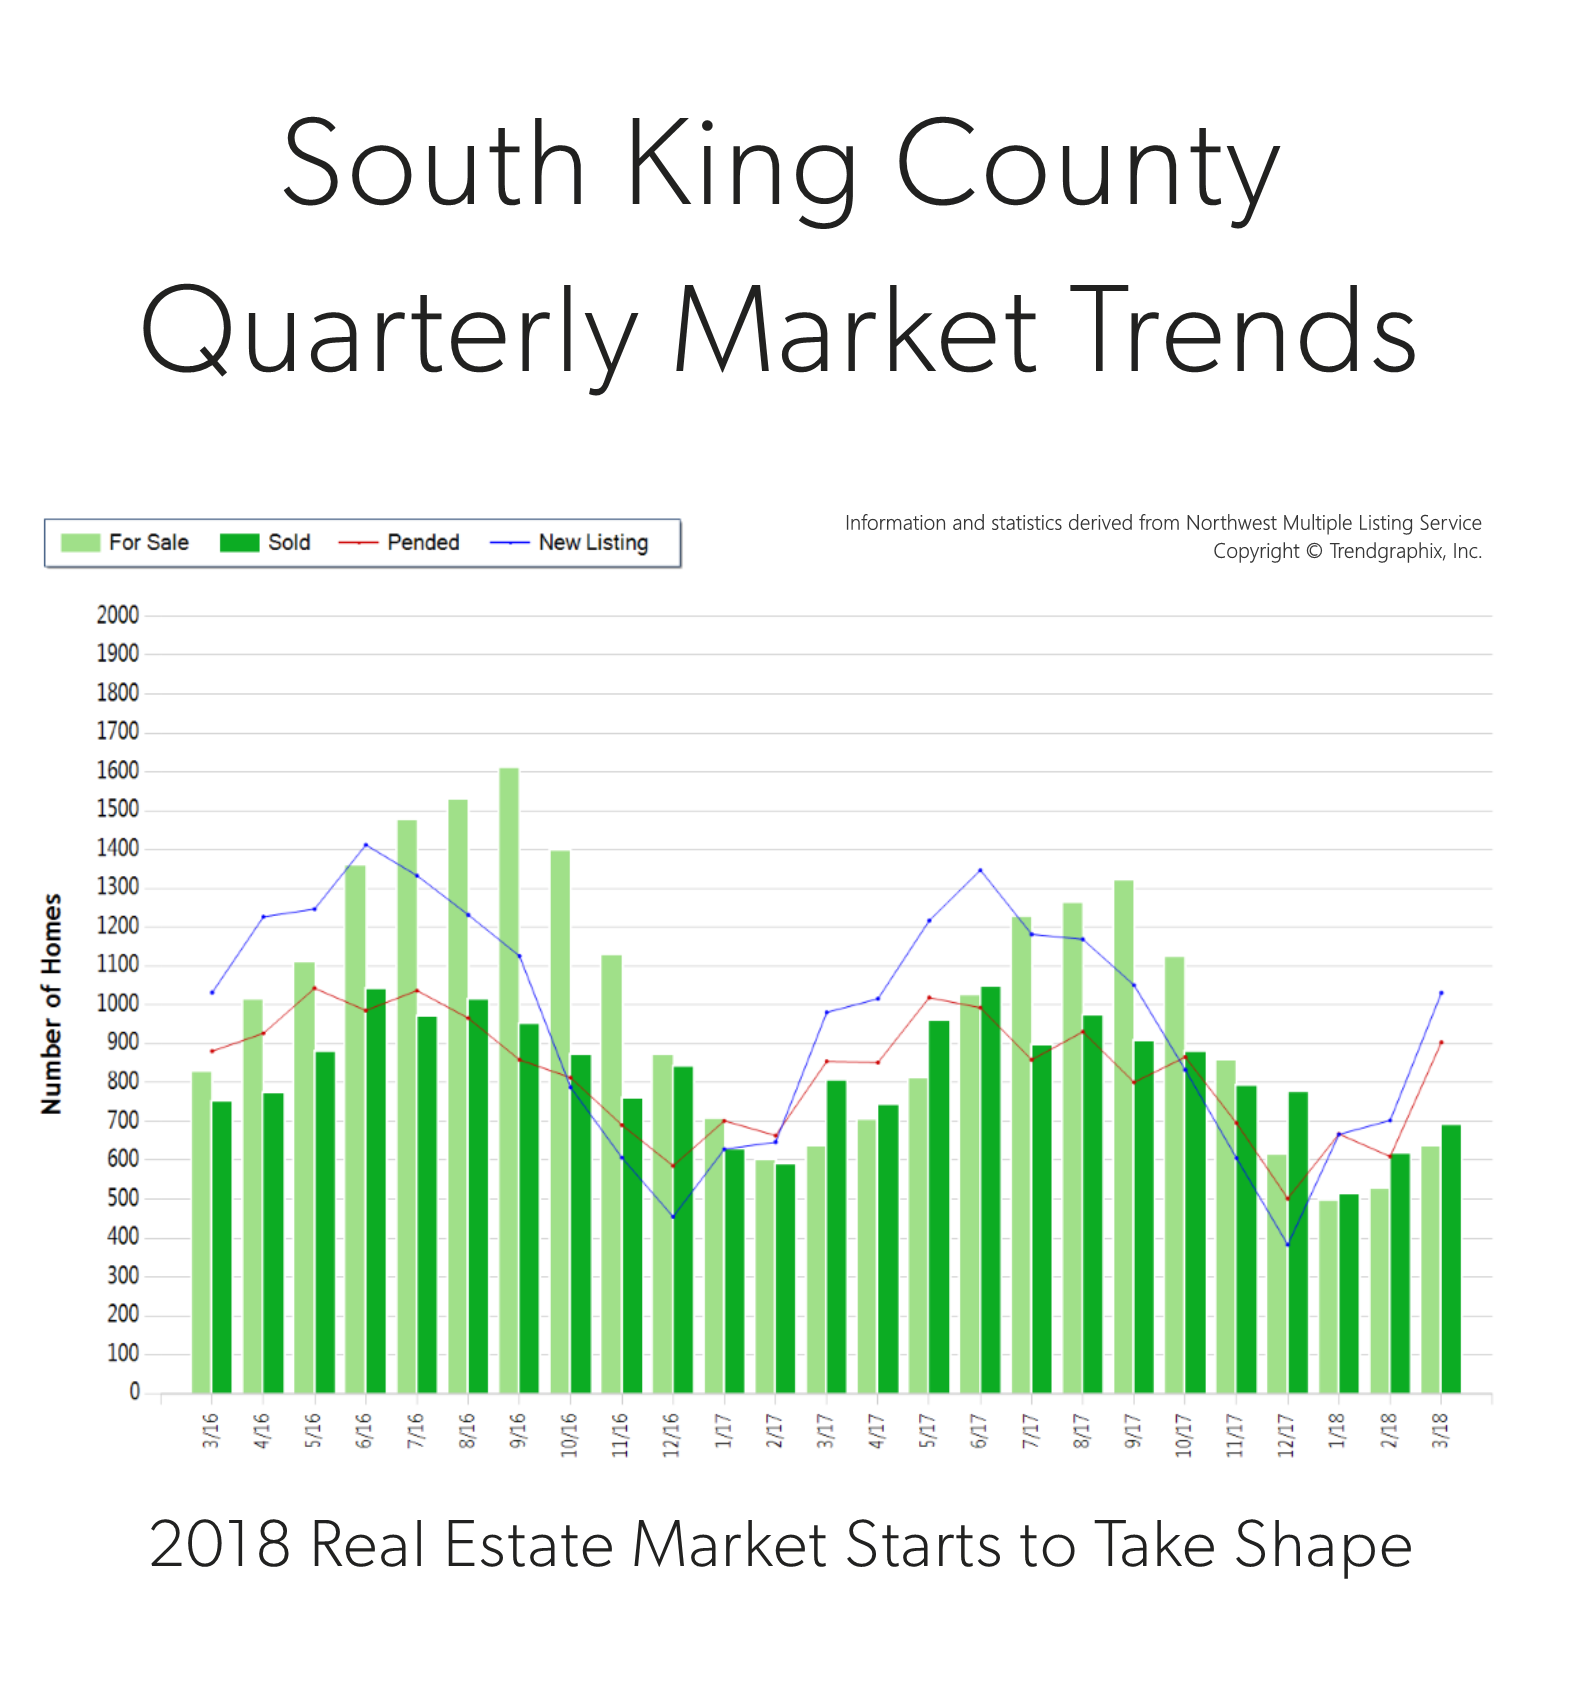

It is the time of year when our market starts to take off. Spring is here and we are starting to see seasonal increases in inventory. In fact, there was a 47% increase in new listings in March compared to February. That increase was matched by a 48% rise in pending sales, illustrating very strong demand for housing in your area. Last month, the average list-to-sale price ratio (the amount the sale price topped the list price) was 101%, indicating that multiple offers were the norm. We ended the quarter with 0.7 months of inventory – the lowest level yet. More inventory would be absorbed by happy buyers looking for more selection and would help temper price growth, which is up 12% year-over-year.
South King County real estate has been a hot spot due to reasonable commute times and overall affordability compared to “in-city” real estate. In fact, the median price in March was 78% higher in Seattle Metro. Sellers are enjoying amazing returns due to this phenomenon, and buyers are securing mortgages with minor debt service due to low interest rates. This is a very strong seller’s market, but buyers who are securing a home are already enjoying appreciation in equity.
This is only a snapshot of the trends in south King County; please contact me if you would like further explanation of how the latest trends relate to you.
What the Same House Sold for 3 Years Later!
Price Appreciation Case Studies in North King & South Snohomish Counties
17836 1st Ave NE, Shoreline • 4 bedroom • 2,917 sq ft
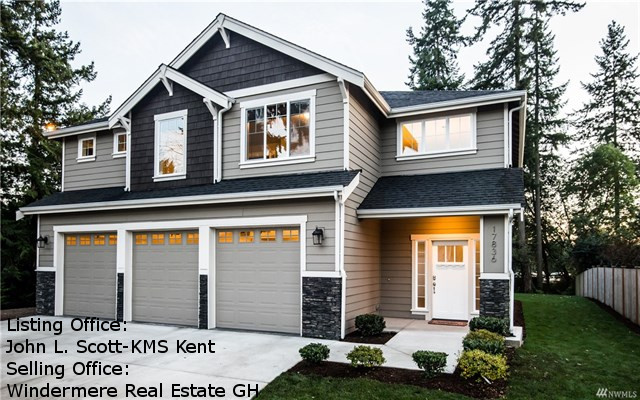

Sold in November 2014
$560,000
Sold in January 2018
$800,000
$240,000 INCREASE IN HOME VALUE: 42.85%
18407 62nd Pl W, Lynnwood • 3 bedroom • 1,305 sq ft
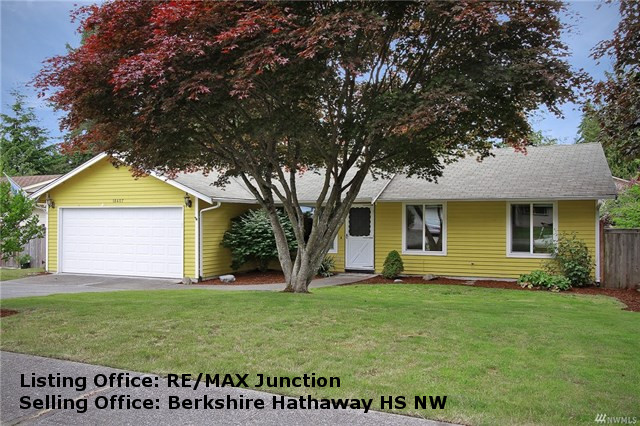
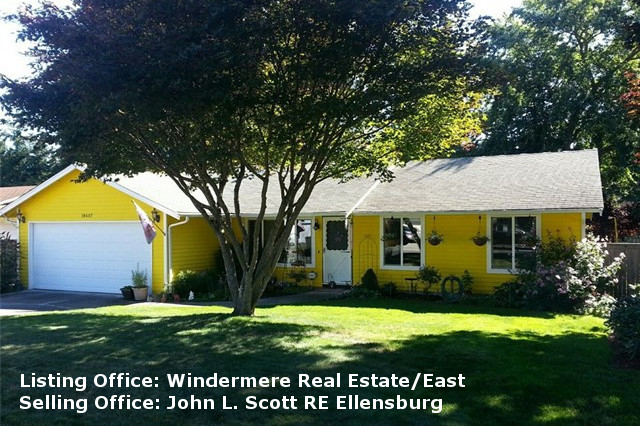
Sold in September 2014
$315,000
Sold in July 2017
$450,000
$135,000 INCREASE IN HOME VALUE: 42.85%
Since 2014, home values have grown by over 10% each year, resulting in a resounding 35% or more return in pricing. Above are some examples of actual homes sold in late 2017 to early 2018 that also sold in 2014, and that were not remodeled or significantly improved in between sales. These examples show the growth in home values that we have experienced over the last three years due to our thriving local economy. I pulled these examples to show you actual pound-for-pound market data versus the statistical percentages I often quote in these market updates. I thought these examples were pretty telling and quite exciting.
This phenomenon has been driven by a lack of available housing inventory and super high demand due to the robust job market in our area influenced by companies like Amazon. In 2017, there were 1,000 people moving into our area each week! According to census data, that trend is supposed to continue.
The large price gains might seem familiar to the gains of the previous up market of 2004-2007 that resulted in a bubble, but this environment is much different, which is why we are not headed toward a housing collapse. Previous lending practices allowed people to get into homes with risky debt-to-income ratios, low credit scores, and undocumented incomes. A large part of why the housing bubble burst 10 years ago was due to people getting into mortgages they were not equipped to handle, which lend to the eventual fall of sub-prime lending and the bubble bursting. Matthew Gardner, Windermere’s Chief Economist speaks to this topic in this video.
It is supply and demand that is creating these huge gains in prices. An increase in inventory would be healthy and would temper price growth. Many folks who have been waiting for their current home values to return in order to make big moves involving their retirement, upgrading homes, investing, or even buying a second home are well poised to enter the market. If you are one of those people, I hope these examples provide insight on the increase in home values and how they might pertain to your goals.
Potential buyers might shy away from the market due to affordability. While it is expensive to buy a home in the Greater Seattle area, the people that have become homeowners over the last three years have built some amazing wealth. Interest rates remain low, helping to absorb the cost of a home in our area. Last month, I wrote a Love Letter to Buyers which helped layout the advantages of participating in today’s market and how to be successful. If you or any one you know is considering making a purchase, it is worth the read.
As we head into the active spring and summer months, if you’d like me to provide you a complimentary Comparable Market Analysis (CMA) on your home, so you have a better understanding of your home’s value, I’d be happy to do that. This would be an important component in charting your 2018 financial goals, and what a great time of year to gather that information! It is my goal to help keep my clients informed and empower strong decisions.

Celebrate Earth Day with us! Bring all your sensitive documents to be professionally destroyed on-site by Confidential Data Disposal. Limit 20 file boxes per customer.
We will also be collecting non-perishable food and cash donations to benefit Concern for Neighbors Food Bank. Donations are not required, but are appreciated.
Saturday, April 21st, 10am – 2pm.
4211 Alderwood Mall Blvd, Lynnwood 98036
*This is a shredding-only event. Only paper will be accepted – no electronics or recyclables.

Spring Gardening Tips to Help Get Your Yard Flourish-Ready
It is approaching that time of year when April showers will start to bring May flowers, so no better time to get outside to start prepping the garden. First, one must get their hands dirty cleaning out the beds, tending the soil and trimming back plants to prepare for new plantings and fresh growth. For a complete list of Spring gardening tips, click here.
A Love Letter to Buyers


I hope your Valentine’s Day was a sweet one, but it got me thinking. I am often sharing with you the advantages of this market for home sellers, which is unbelievably positive. With that said, I thought I’d take some time to give the potential buyers in our marketplace some love, hope, and of course, data!
Dear Greater Seattle Home Buyer,
Let’s just be up front: buying a home in today’s market is not easy. Quite frankly, it can be a wild roller coaster ride with twists and turns; but remember, folks pay a lot of money and stand in long lines for roller coaster rides. Imagine the excited pit in your stomach as the cart clicks up to the highest point before you plunge down a steep drop, and the thrill of raising your hands up because you trust that you are going to be okay. These emotions also accurately reflect the feelings of today’s home buyer – it can be a wild ride! Let’s also note that many roller coaster riders return to the back of the line right after getting off. Home ownership is also a good exercise to repeat and is often the investment that leads to the most built wealth in one’s life.
So how does one ensure that they are not the Nervous Nelly who stands in line for over an hour, finally makes it to the front to be strapped in to the cart, but who then chooses to bow out? The one that sits on the sidelines watching others throw up their hands with a thrill in their eye; the one with that tinge of regret as their friends rejoin them back on hallowed ground to recount their adventure. Wow, this is getting dramatic! Here are a few tips to follow that will ensure that one can find success securing a home in today’s market and get on the equity building train.
Waiting is Even More Expensive
In 2017, the year-over-year median price gains across our region were strong. In fact, here is a little break down.
| North Snohomish County: | $371,000 | up 13% |
| South Snohomish County: | $508,000 | up 14% |
| North King County: | $715,000 | up 14% |
| Seattle Metro: | $710,000 | up 15% |
| South King County: | $405,000 | up 13% |
| Eastside: | $865,000 | up 15% |
This aspect is actually one to pay very close attention to. We have been amazingly spoiled with historically low interest rates over the last five years. In fact, there is an entire generation of buyers who only know rates that have hovered from 3.5 – 4.5% – that is close to 3 points under the 30-year average! A good rule of thumb regarding interest rates, is that for each 1-point increase a buyer loses 10% of their buying power. That means that if you have a $500,000 budget and the rate goes up by a point, that you are now shopping for a $450,000 house if you want the same payment. Note, that shift does not take appreciation into consideration. Today’s rates have helped buyers bear the home prices in our area. It is predicted that rates will rise in 2018 by .5 to 1%.Rents are High and Don’t Build Wealth
Seattle is now the 5th most expensive city to rent in the country according to the US Census Bureau. With rising rental rates, still historically low interest rates, and home prices on the rise, the advantage of buying versus renting has become clear for folks who have a down payment saved, good debt-to-income ratios and strong credit. Currently, the breakeven horizon (the amount of time you need to own your home in order for owning to be a superior financial decision vs. renting) in the Greater Seattle area is 1.6 years according to Zillow research.
Partner with a Broker Who Will Get the Job Done
A broker that has a process is key! It starts with an initial buyer consultation. I liken the buyer consultation to the seat belt you would wear on the roller coaster ride. When you go to the Dr. they start with your intake, check your vitals, ask questions, etc. The buyer consultation aims to unearth a buyer’s goals, research the areas they are interested in, address financing, and illustrate the challenges of the environment, so one can be successful. Time is money, and this consultation brings clarity, efficiency and trust. This upfront education coupled with a high level of communication and availability is paramount. The depth of the relationship will lead to success, and is the ingredient that enables a buyer to throw up their hands and take the thrilling plunge. It is hard to do that without a seat belt!
Get Your Finances in Order
Aligning with a trusted real estate professional is key, but so is aligning with a reputable and responsive mortgage lender. Getting pre-approved is the minimum, but getting pre-underwritten is a game changer. Finding a lender that is willing to put in the work up-front to vet credit, income, savings, debt, and all other financial indicators will lead to being pre-underwritten, which listing agents and sellers appreciate! Also, be aware that you do not always need to have a huge down payment to make a purchase work. Employment, assets, credit, and what you have saved all work into your ability to acquire a loan. I have seen plenty of people secure a home with 3-5% down. Education and awareness create clarity, and investing into understanding your financial footing equals empowered and more efficient decisions. Note that I mentioned “responsive”. This is a 24/7 market, and lenders who don’t work evenings and weekends can get in the way of a buyer securing a home. If you need a short list of lenders that fit this description, please contact me.
‘Tis the Season – Inventory is Coming
Have hope! This is the time of year where we see inventory climb month over month. There will be more selection, but bear in mind it is also the time of year that the appreciation push happens. If you are feeling 75-80% in love with a home, it is one to act on. You’re never going to “get it all”, so a willingness to focus on priorities will pay off, because waiting will have an expense.
If you or someone you know is considering a purchase in today’s market, please contact me. It is my pleasure to take the time to educate, devise a plan, and help buyers find success in a challenging, yet advantageous market.
Commute Times, Price Premiums: The Value of Location, Location, Location


Flickr Photo/SounderBruce (CC BY SA 2.0)/http://flic.kr/p/MzGznr
Commute Times, Price Premiums: The Value of Location, Location, Location
It is the time of year when I like to re-cap the price premiums in our area based on commute times. The price divide continued in 2017 between key market areas in the Greater Seattle area based on proximity to major job centers. These pricing premiums have cemented the drive-to-qualify market. Seattle proper has always been more expensive than its neighboring suburbs, but the most current prices illustrate the extreme value of a shorter commute.
In 2017, the average sales price for a single-family residential home in the Seattle Metro area was $801,000, up 14% from the year prior! In south Snohomish County (Everett to the King County line) the average sales price for a single-family residential home in 2017 was $543,000, up 12% from the year prior, however 48% less expensive than Seattle Metro.
Further, if you jump across Lake Washington to the Eastside, the average sales price in 2017 for a single-family residential home was $1,049,000, up 16% from the year prior and 31% more expensive than Seattle Metro! The Eastside has the infrastructure to support their own job centers, making it a second “Seattle”, with the benefit of newer and larger housing stock, which reflects the pricing. Many folks are living and working on the Eastside, or using the 520 toll bridge to jump over to Seattle.
In 2017, closed transactions were up 4% in south Snohomish County despite fewer new listings coming to market, which I think was driven by its affordability compared to Seattle and the Eastside. Snohomish County offers lower prices, larger houses and yards, new construction, lower taxes, strong school district options and longer, yet manageable commute times. Newer transit centers and telecommuting have also opened up doors to King County’s little brother to the north.
Another hot button that has continued to influence pricing is the future expansion of Light Rail and the locations of the planned stations. We have seen home values in these areas sell at a premium as consumers anticipate the shorter commute times the rail will bring. These neighborhoods are experiencing zoning changes now and the additional expansion is being phased in over the course of the next 15 years. There will be more multi-family and commercial development in these areas, creating more density to serve the public using these commuting services. This has created great appeal for homeowners that want to get in on the ease of nearby public transportation, and developers eager to be part of the infrastructure growth. Stations at Northgate, 145th & 185th in Shoreline, Mountlake Terrace and Lynnwood are all slated to open over the next 3-6 years.
No matter which neighborhood you are interested in learning about, in either King or Snohomish County, I am happy to provide a 2017 re-cap of that market. I work in both counties and understand each of their nuances. 2017 was another eventful year in real estate and we are looking for that to continue in 2018. With these strong market prices, we hope to see an increase in inventory levels, providing more options for buyers and allowing price growth to temper to sustainable levels. Check out the article below that touches on Matthew Gardner’s, Windermere’s Chief Economist, 2018 predictions for the national housing market. I attended his local forecast this week and if you’d like a copy of his presentation, outlining what he thinks is in store for our area, please email me. I’d be happy to forward it along and explain his findings. Here’s to a successful 2018!
Quarterly Report – South King County

 Price growth was particularly strong in 2017! Median was up 13% and average price up 12% over 2016. Median price in 2017 landed at $405,000 and the average at $440,000. The average amount of days it took to sell a house in 2017 was 30 days which is 9% faster than 2016. The average list-to-sale price ratio over the last year was 100%, with the spring months as high as 102%! In 2017, inventory growth continued to be a challenge, with a 7% decrease in new listings compared to 2016. Even with inventory limitations there were 2% more sales! This phenomenon illustrates strong buyer demand and a need for more listings.
Median Price up 13%, Average Price up 12% Year-Over-Year
South King County real estate has seen a steady stream of buyers come our way due to affordability, reasonable commute times and quality of life. In fact, the median price in 2017 was 75% higher in Seattle Metro. Historically low interest rates continue to drive the market as well, they have helped offset the increase in prices. Sellers are enjoying great returns due to this phenomenon and buyers are securing mortgages with minor debt service.
This is only a snapshot of the trends in south King County; please contact me if you would like further explanation of how the latest trends relate to you.
Quarterly Report – Eastside
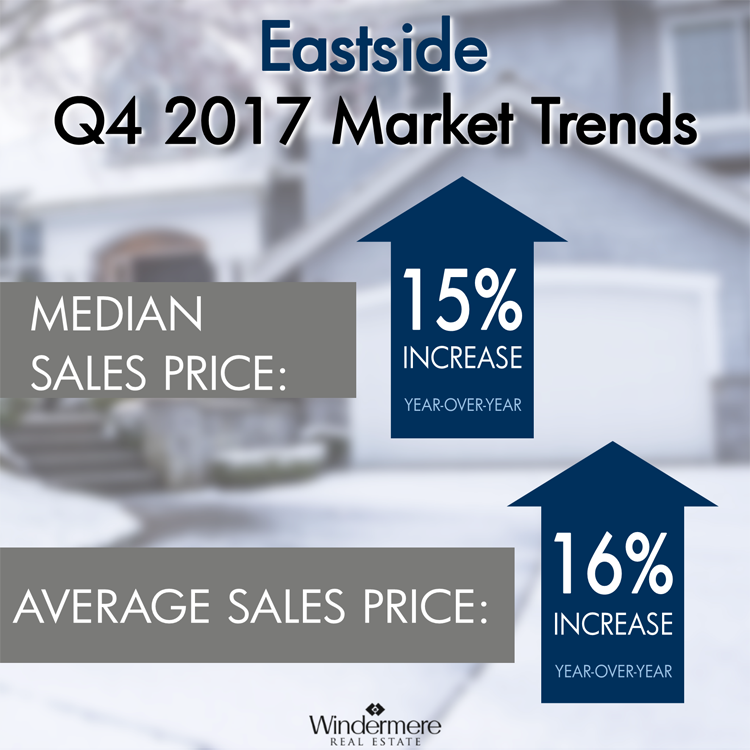
 Price growth was particularly strong in 2017! Median was up 15% and average price up 16% over 2016. Median price in 2017 landed at $865,000 and the average at $1,049,000. The average amount of days it took to sell a house in 2017 was 24 days, which is 17% faster than 2016. The average list-to-sale price ratio over the last year was 101%, with the spring months as high as 103%! In 2017, inventory growth continued to be a challenge, with a 4% decrease in new listings compared to 2016. Even with inventory limitations there were a near equal amount of sales! This phenomenon illustrates strong buyer demand and a need for more listings.
Median Price up 15%, Average Price up 16% Year-Over-Year
Demand for Eastside real estate has grown due to close proximity to job centers, great schools and quality of life. Over the last year, the Eastside was 70% more expensive than south Snohomish County and 22% over Seattle Metro. Historically low interest rates continue to drive the market as well, they have helped offset the increase in prices. Sellers are enjoying great returns due to this phenomenon and buyers are securing mortgages with minor debt service.
This is only a snapshot of the trends on the Eastside area; please contact me if you would like further explanation of how the latest trends relate to you.
Quarterly Report – Seattle Metro

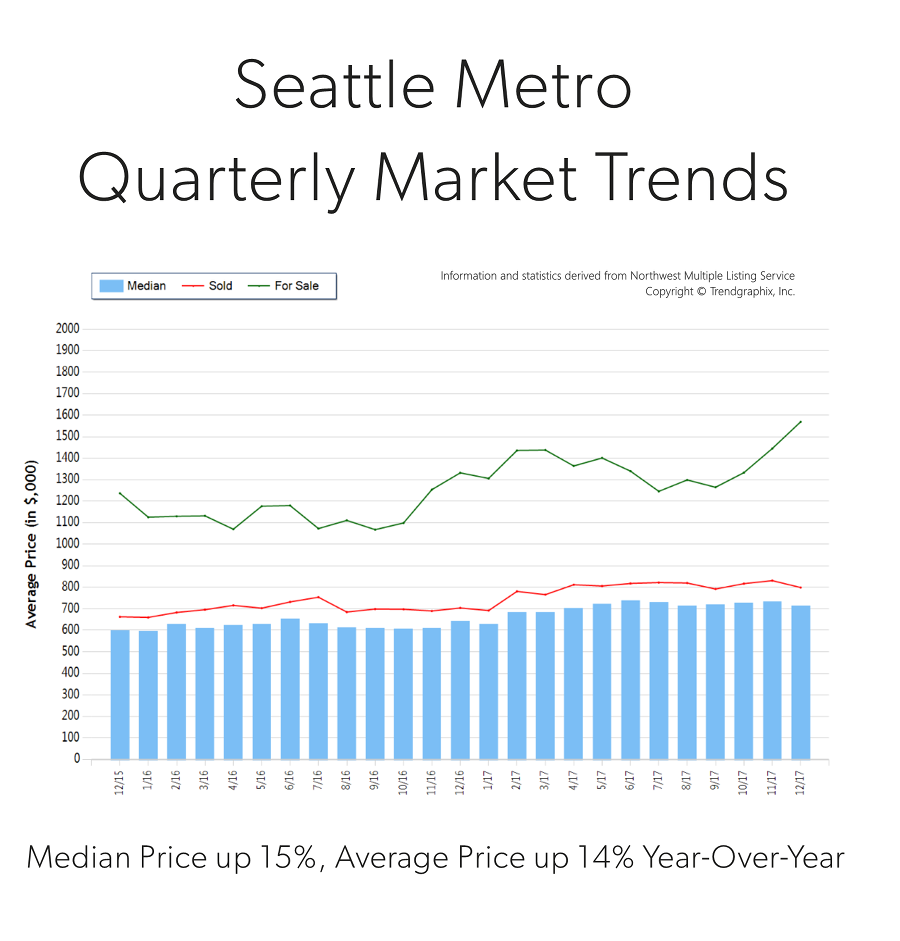 Price growth was particularly strong in 2017! Median was up 15% and average price up 14% over 2016. Median price in 2017 landed at $710,000 and the average at $801,000. The average amount of days it took to sell a house in 2017 was 18 days, which is 10% faster than 2016. The average list-to-sale price ratio over the last year was 103%, with the spring months as high as 106%! In 2017, inventory growth continued to be a challenge, with a 3% decrease in new listings compared to 2016. Even with inventory limitations there were 4% more sales! This phenomenon illustrates strong buyer demand and a need for more listings.
Median Price up 15%, Average Price up 14% Year-Over-Year
Demand for Seattle Metro area real estate has grown due to close proximity to job centers. Over the last year, Seattle Metro was 40% more expensive than south Snohomish County and 75% over south King County. Historically low interest rates continue to drive the market as well, they have helped offset the increase in prices. Sellers are enjoying great returns due to this phenomenon and buyers are securing mortgages with minor debt service.
This is only a snapshot of the trends in the Seattle Metro area; please contact me if you would like further explanation of how the latest trends relate to you.
Quarterly Report – North Snohomish County
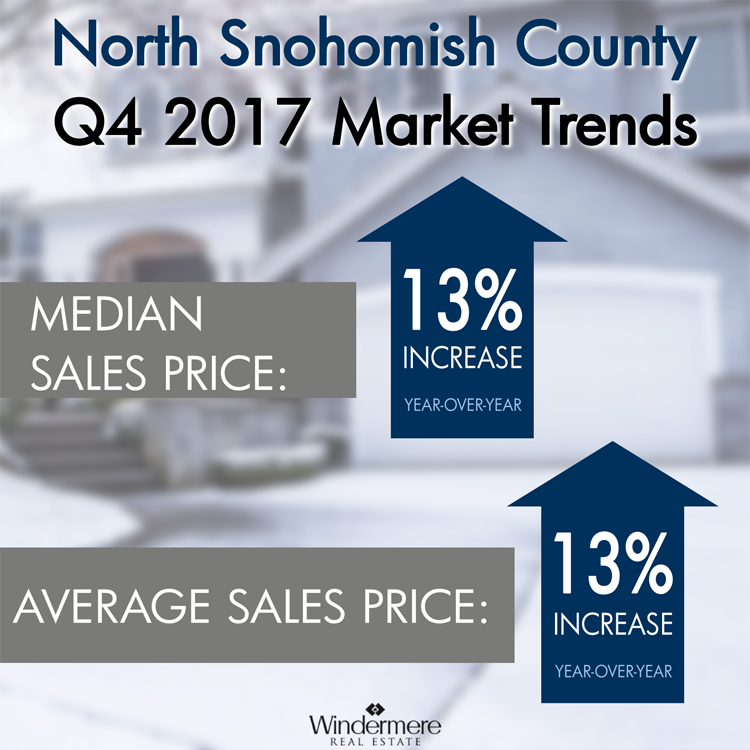

Price growth was particularly strong in 2017! Median and average prices were up 13% over 2016. Median price in 2017 landed at $371,000 and the average at $400,000. The average amount of days it took to sell a house in 2017 was 35 days, which is 10% faster than 2016. The average list-to-sale price ratio over the last year was 99%, with the spring months as high as 101%! In 2017, inventory growth continued to be a challenge, with an 8% decrease in new listings compared to 2016. Even with inventory limitations there were 3% more sales! This phenomenon illustrates strong buyer demand and a need for more listings.
Median Price & Average Prices up 13% Year-Over-Year
North Snohomish County real estate has seen a steady stream of buyers come our way due to affordability and quality of life. In fact, the median price in 2017 was 37% higher in south Snohomish County. Historically low interest rates continue to drive the market as well, they have helped offset the increase in prices. Sellers are enjoying great returns due to this phenomenon and buyers are securing mortgages with minor debt service.
This is only a snapshot of the trends in north Snohomish County; please contact me if you would like further explanation of how the latest trends relate to you.
Quarterly Report – South Snohomish County


Price growth was particularly strong in 2017! Median was up 14% and average price up 12% over 2016. Median price in 2017 landed at $508,000 and the average at $543,000. The average amount of days it took to sell a house in 2017 was 24 days, which is 17% faster than 2016. The average list-to-sale price ratio over the last year was 101%, with the spring months as high as 103%! In 2017, inventory growth continued to be a challenge, with a 1% decrease in new listings compared to 2016. Even with inventory limitations there were 4% more sales! This phenomenon illustrates strong buyer demand and a need for more listings.
Median Price up 14%, Average Price up 12% Year-Over-Year
South Snohomish County real estate has seen a steady stream of buyers come our way due to affordability, reasonable commute times to job centers and quality of life. In fact, the median price in 2017 was 41% higher in north King County. Historically low interest rates continue to drive the market as well, they have helped offset the increase in prices. Sellers are enjoying great returns due to this phenomenon and buyers are securing mortgages with minor debt service.
This is only a snapshot of the trends in south Snohomish County; please contact me if you would like further explanation of how the latest trends relate to you.
Quarterly Report – North King County
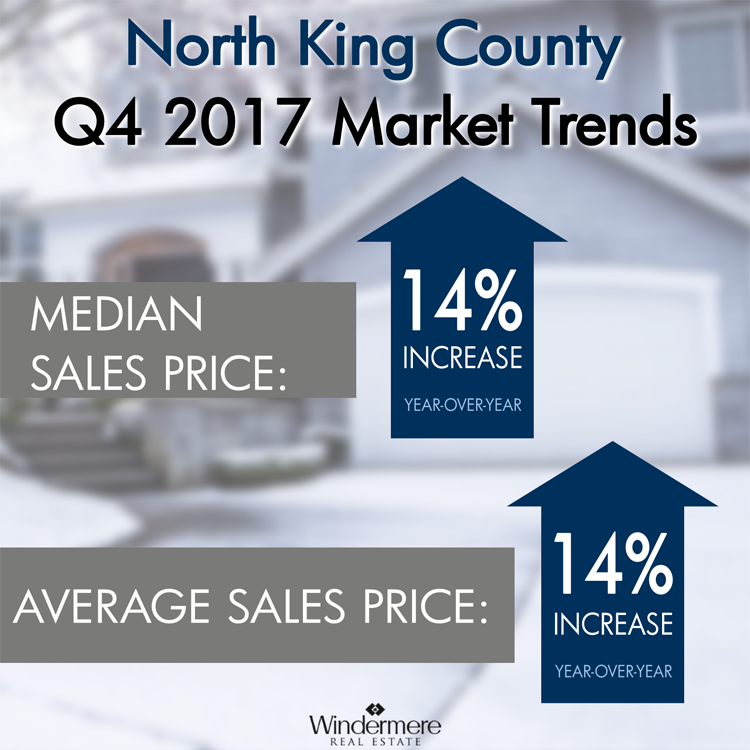

Price growth was particularly strong in 2017! Median and average prices were up 14% over 2016. Median price in 2017 landed at $715,000 and the average at $787,000. The average amount of days it took to sell a house in 2017 was 17 days, which is 19% faster than 2016. The average list-to-sale price ratio over the last year was 104%, with the spring months as high as 107%! In 2017, inventory growth continued to be a challenge, with a 4% decrease in new listings compared to 2016. Even with inventory limitations there were a near equal amount sales! This phenomenon illustrates strong buyer demand and a need for more listings.
Median & Average Prices up 14% Year-Over-Year
Demand for north King County real estate has grown due to close proximity to job centers while maintaining a neighborhood feel. Over the last year, north King County was 41% more expensive than south Snohomish County and 77% over south King County. Historically low interest rates continue to drive the market as well, they have helped offset the increase in prices. Sellers are enjoying great returns due to this phenomenon and buyers are securing mortgages with minor debt service.
This is only a snapshot of the trends in north King County; please contact me if you would like further explanation of how the latest trends relate to you.
