
 Facebook
 X
X
 Pinterest
 Copy Link
South King County Market Trends
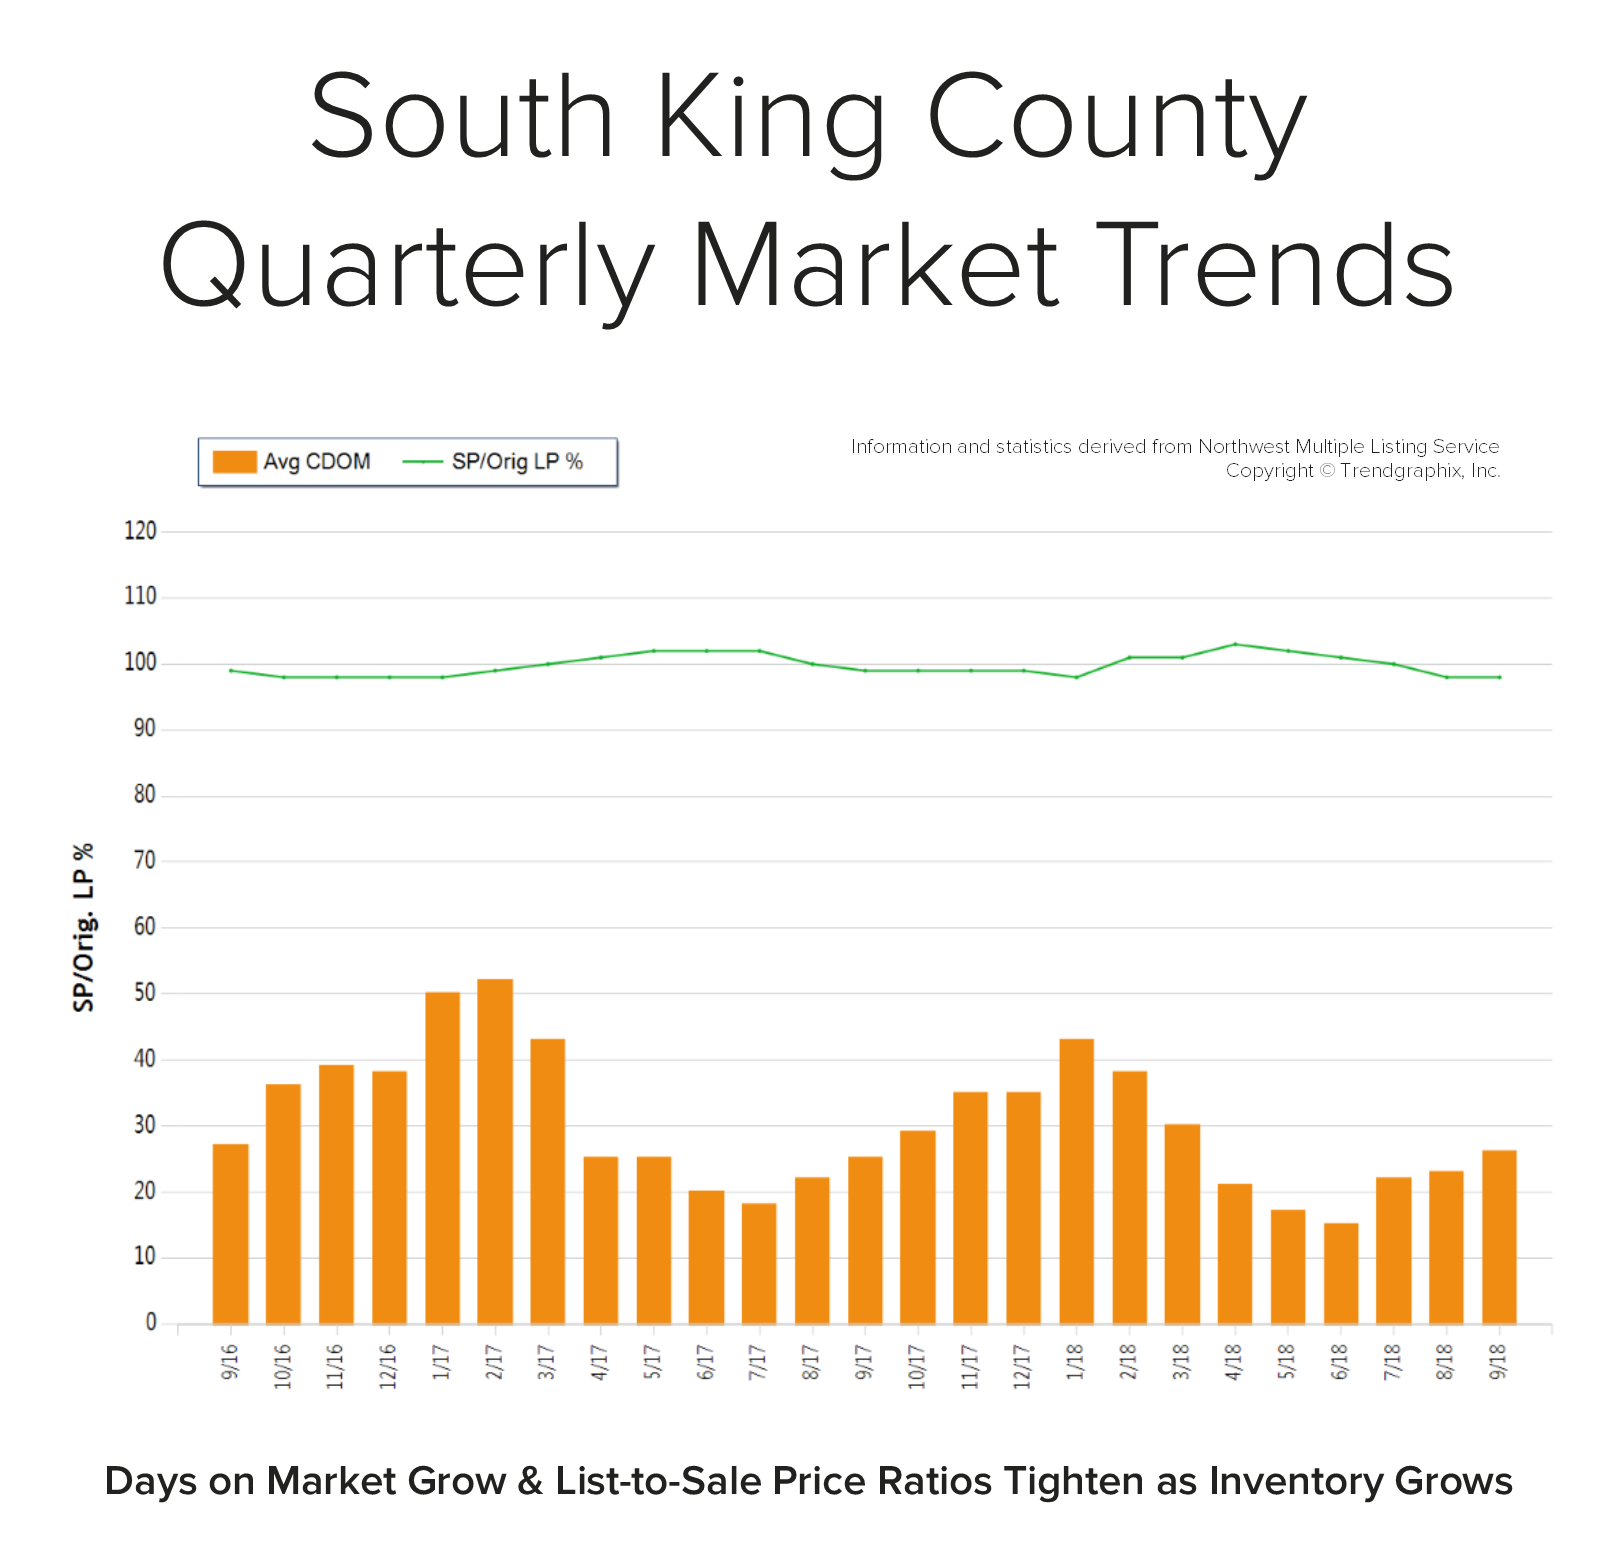
In September, the average days on market landed at 26 days and the original list-to-sale price ratio 98%. Since May, inventory growth has been noticeable, and has given buyers more options. This has led to more negotiations and fewer bidding wars, which is tempering month-over-month price growth to a more sustainable level. Back in April, the average days on market was 21 days and the original list-to-sale price ratio 103%; but months of inventory based on pending sales was 0.9 months, compared to 2.6 months currently. Year-over-year, prices are up 10%, still well above the historical norm of 3%-5% year-over-year gains—but note that the majority of this growth happened during the spring, due to constricted inventory levels.
Supply has increased, creating more options for buyers and helping to buffer affordability issues. Many sellers are deciding to make moves and cash in on the equity gained over the last six years. An average original list-to-sale price ratio of 98% is a positive return, yet illustrates a softening in the market after some very extreme times. With 10% price growth over the last 12-months in a seller’s favor, the increase in selection has led to more nimble moves from one house to another. Where sellers need to be careful is anticipating the month-over-month price growth we saw prior to the shift in inventory. Prospective buyers would be smart to take advantage of today’s historically low interest rates and the added inventory selection.
This is only a snapshot of the trends in south King County; please contact me if you would like further explanation of how the latest trends relate to you.
Eastside Quarterly Market Trends
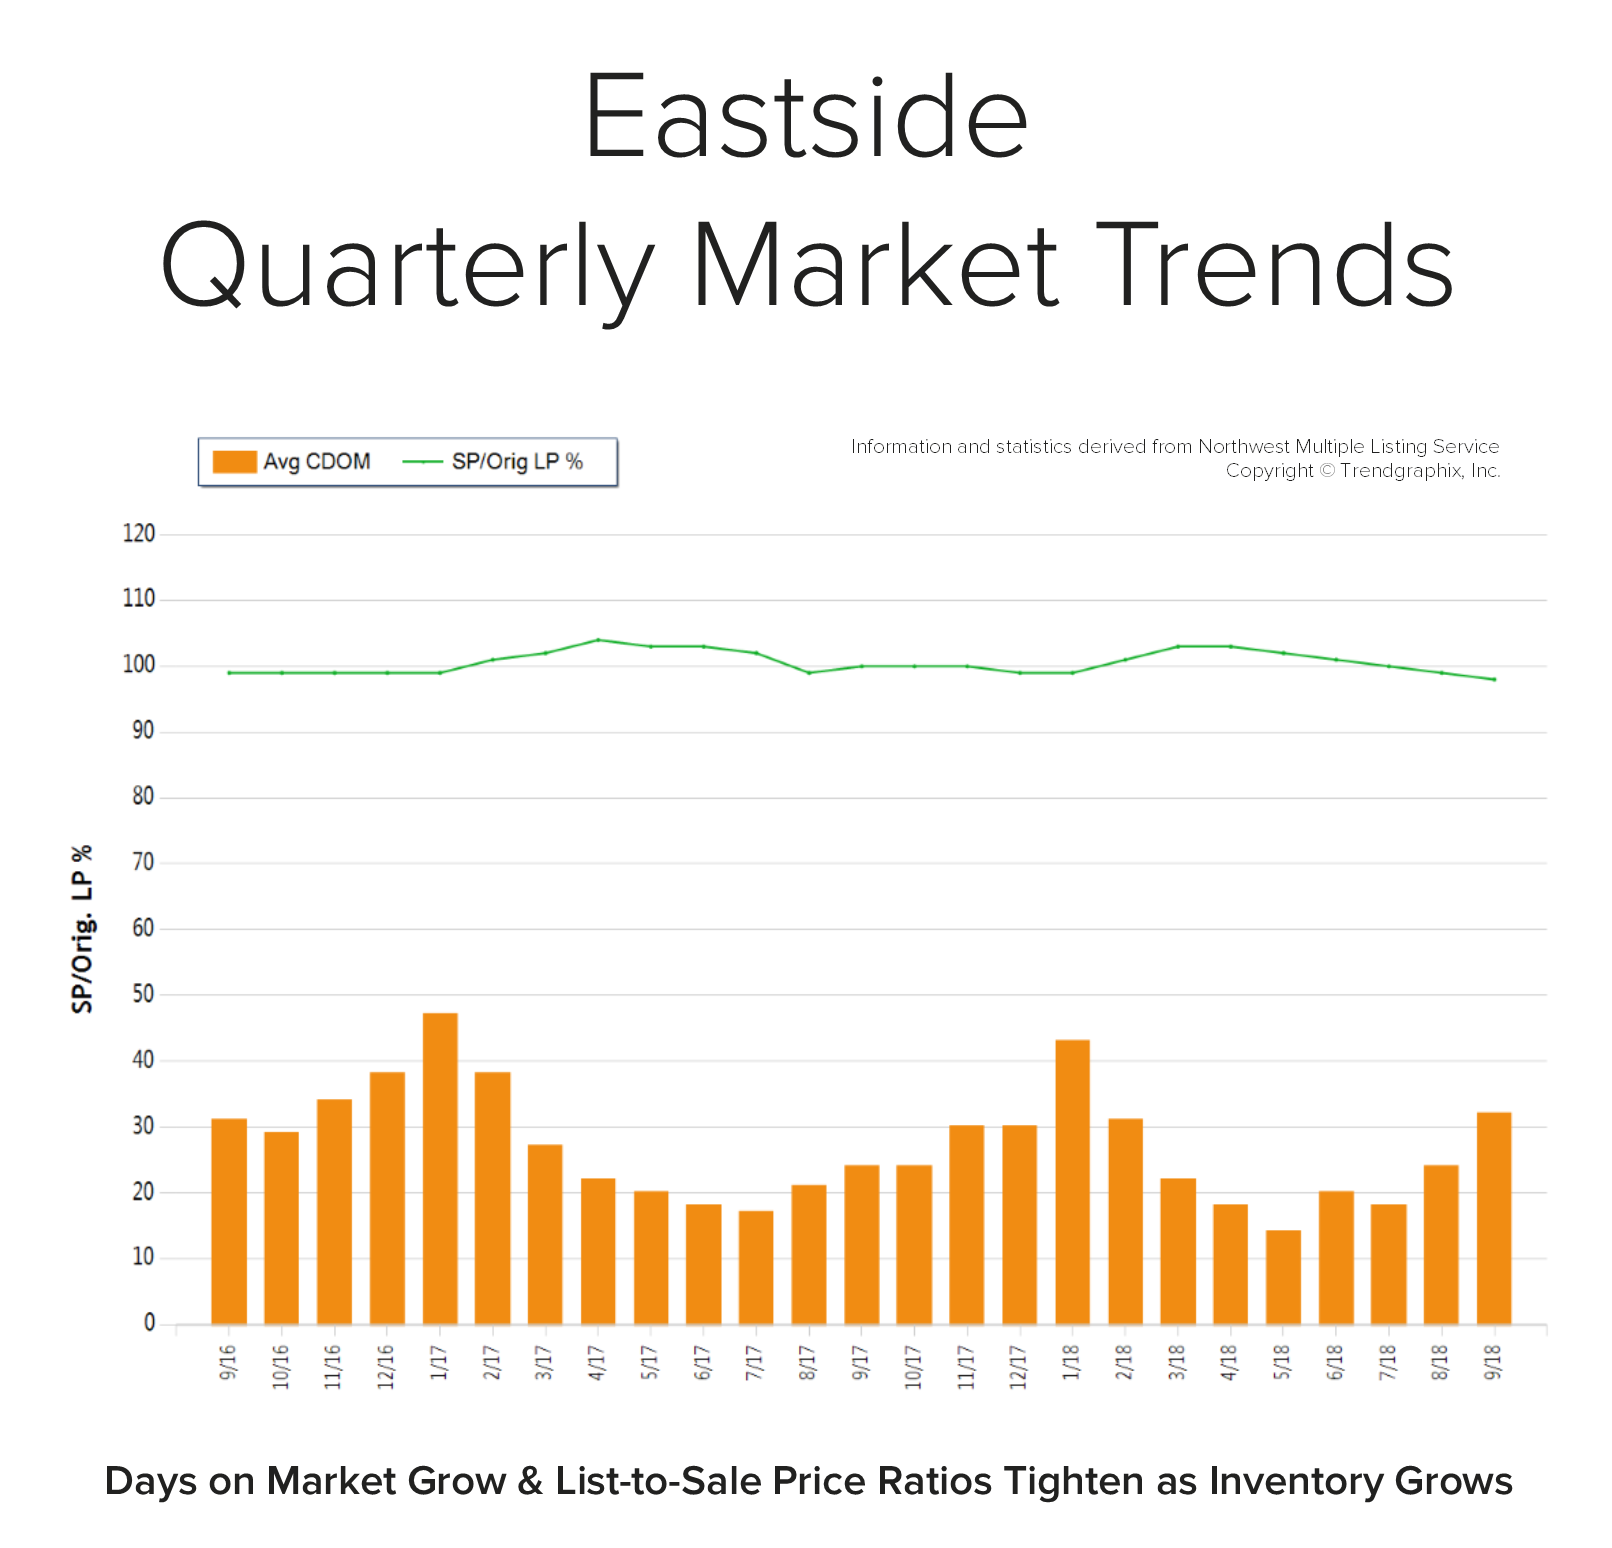
In September, the average days on market landed at 32 days and the original list-to-sale price ratio 98%. Since May, inventory growth has been noticeable, and has given buyers more options. This has led to more negotiations and fewer bidding wars, which is tempering month-over-month price growth to a more sustainable level. Back in April, the average days on market was 13 days and the original list-to-sale price ratio 103%; but months of inventory based on pending sales was 0.8 months, compared to 2.9 months currently. Year-over-year, prices are up 10%, still well above the historical norm of 3%-5% year-over-year gains—but note that the majority of this growth happened during the spring, due to constricted inventory levels.
Supply has increased, creating more options for buyers and helping to buffer affordability issues. Many sellers are deciding to make moves and cash in on the equity gained over the last six years. An average original list-to-sale price ratio of 98% is a positive return, yet illustrates a softening in the market after some very extreme times. With 10% price growth over the last 12-months in a seller’s favor, the increase in selection has led to more nimble moves from one house to another. Where sellers need to be careful is anticipating the month-over-month price growth we saw prior to the shift in inventory. Prospective buyers would be smart to take advantage of today’s historically low interest rates and the added inventory selection.
This is only a snapshot of the trends on the Eastside; please contact me if you would like further explanation of how the latest trends relate to you.
Seattle Metro Quarterly Market Trends
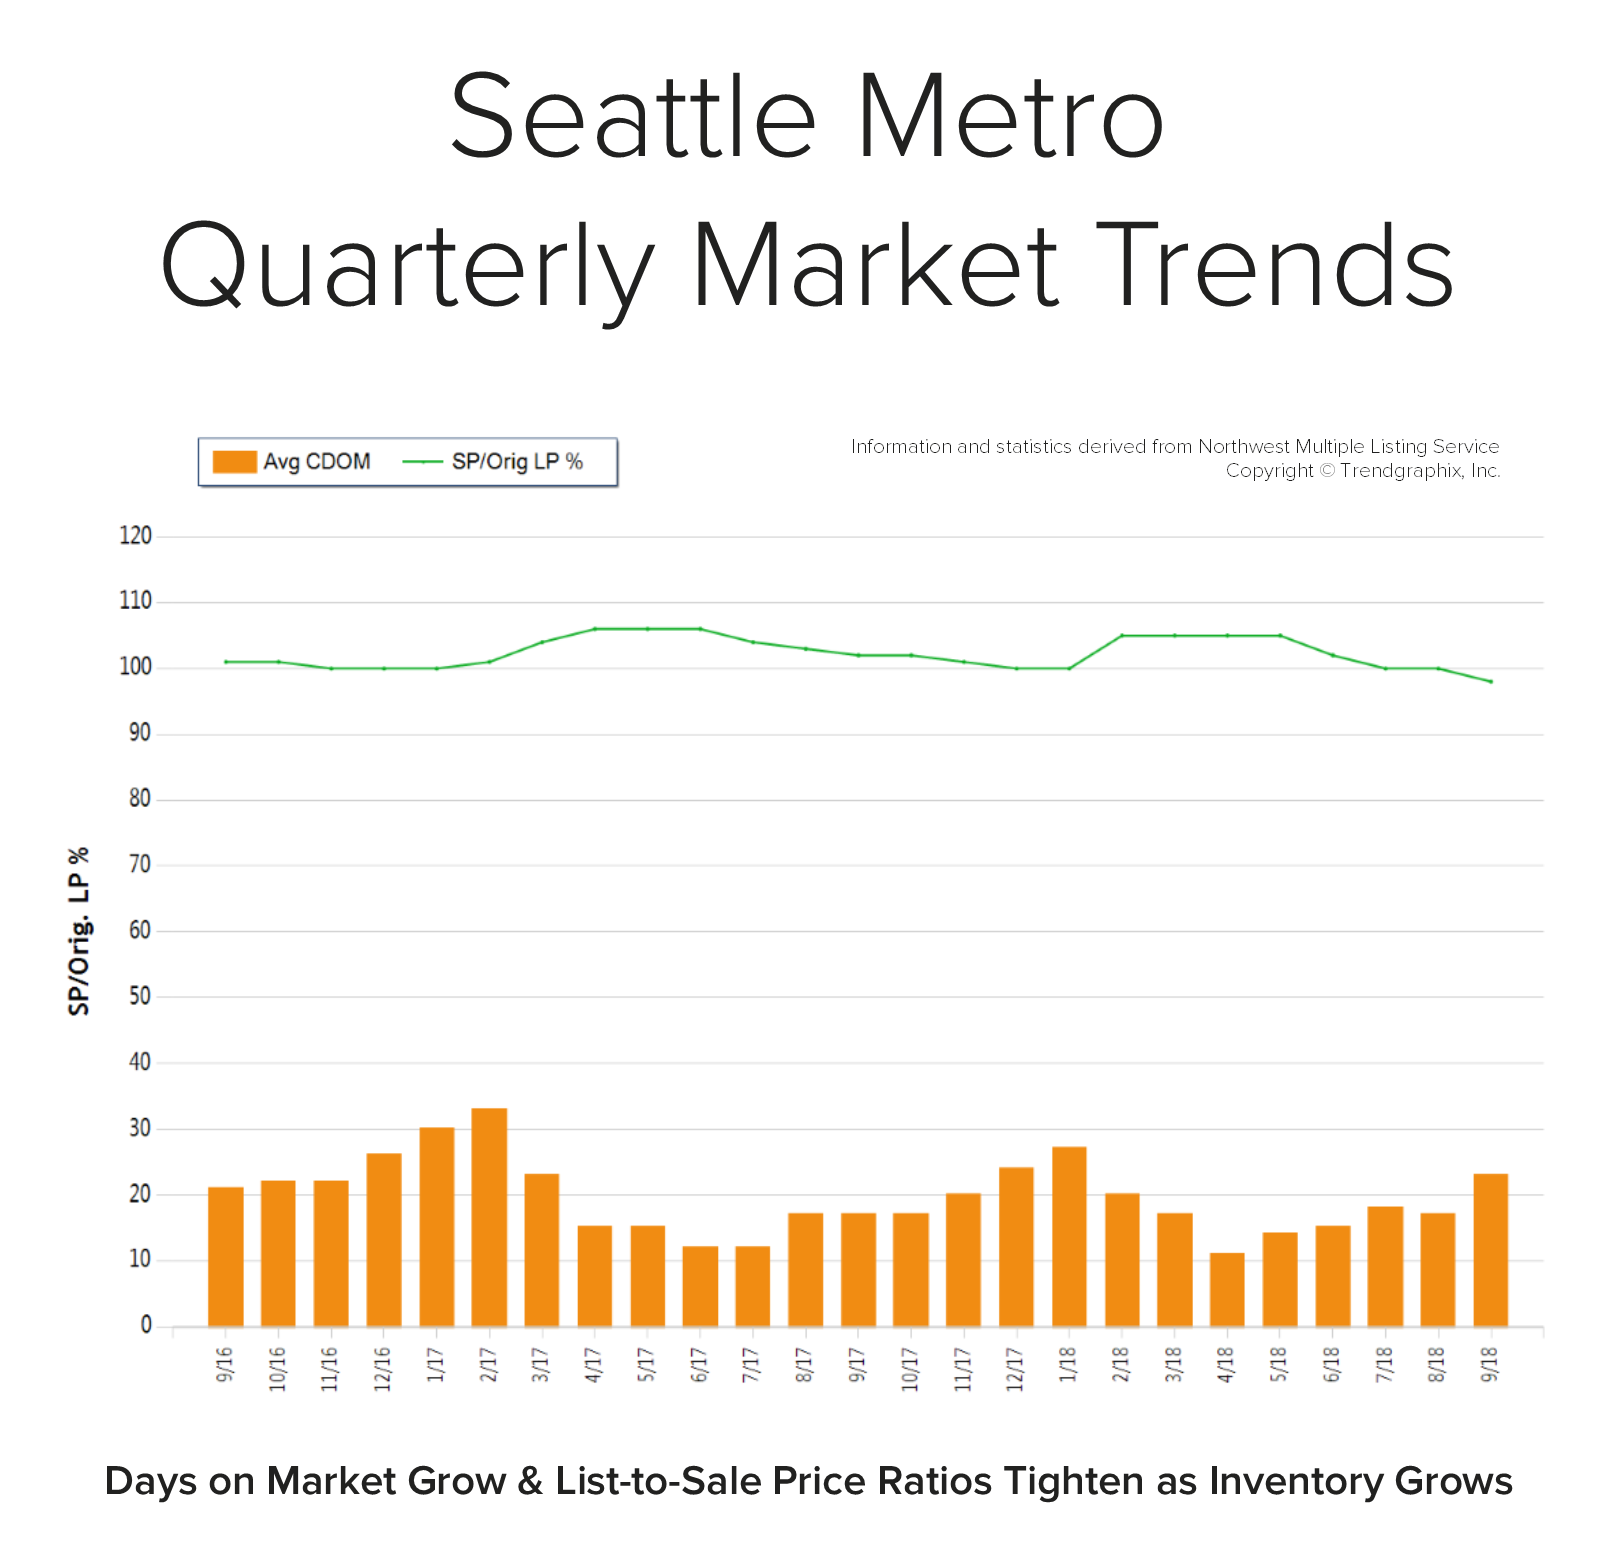
In September, the average days on market landed at 23 days and the original list-to-sale price ratio 98%. Since May, inventory growth has been noticeable, and has given buyers more options. This has led to more negotiations and fewer bidding wars, which is tempering month-over-month price growth to a more sustainable level. Back in April, the average days on market was 11 days and the original list-to-sale price ratio 105%; but months of inventory based on pending sales was 0.8 months, compared to 2.4 months currently. Year-over-year, prices are up 11%, still well above the historical norm of 3%-5% year-over-year gains—but note that the majority of this growth happened during the spring, due to constricted inventory levels.
Supply has increased, creating more options for buyers and helping to buffer affordability issues. Many sellers are deciding to make moves and cash in on the equity gained over the last six years. An average original list-to-sale price ratio of 98% is a positive return, yet illustrates a softening in the market after some very extreme times. With 10% price growth over the last 12-months in a seller’s favor, the increase in selection has led to more nimble moves from one house to another. Where sellers need to be careful is anticipating the month-over-month price growth we saw prior to the shift in inventory. Prospective buyers would be smart to take advantage of today’s historically low interest rates and the added inventory selection.
This is only a snapshot of the trends in the Seattle Metro area; please contact me if you would like further explanation of how the latest trends relate to you.
North King County Quarterly Market Trends
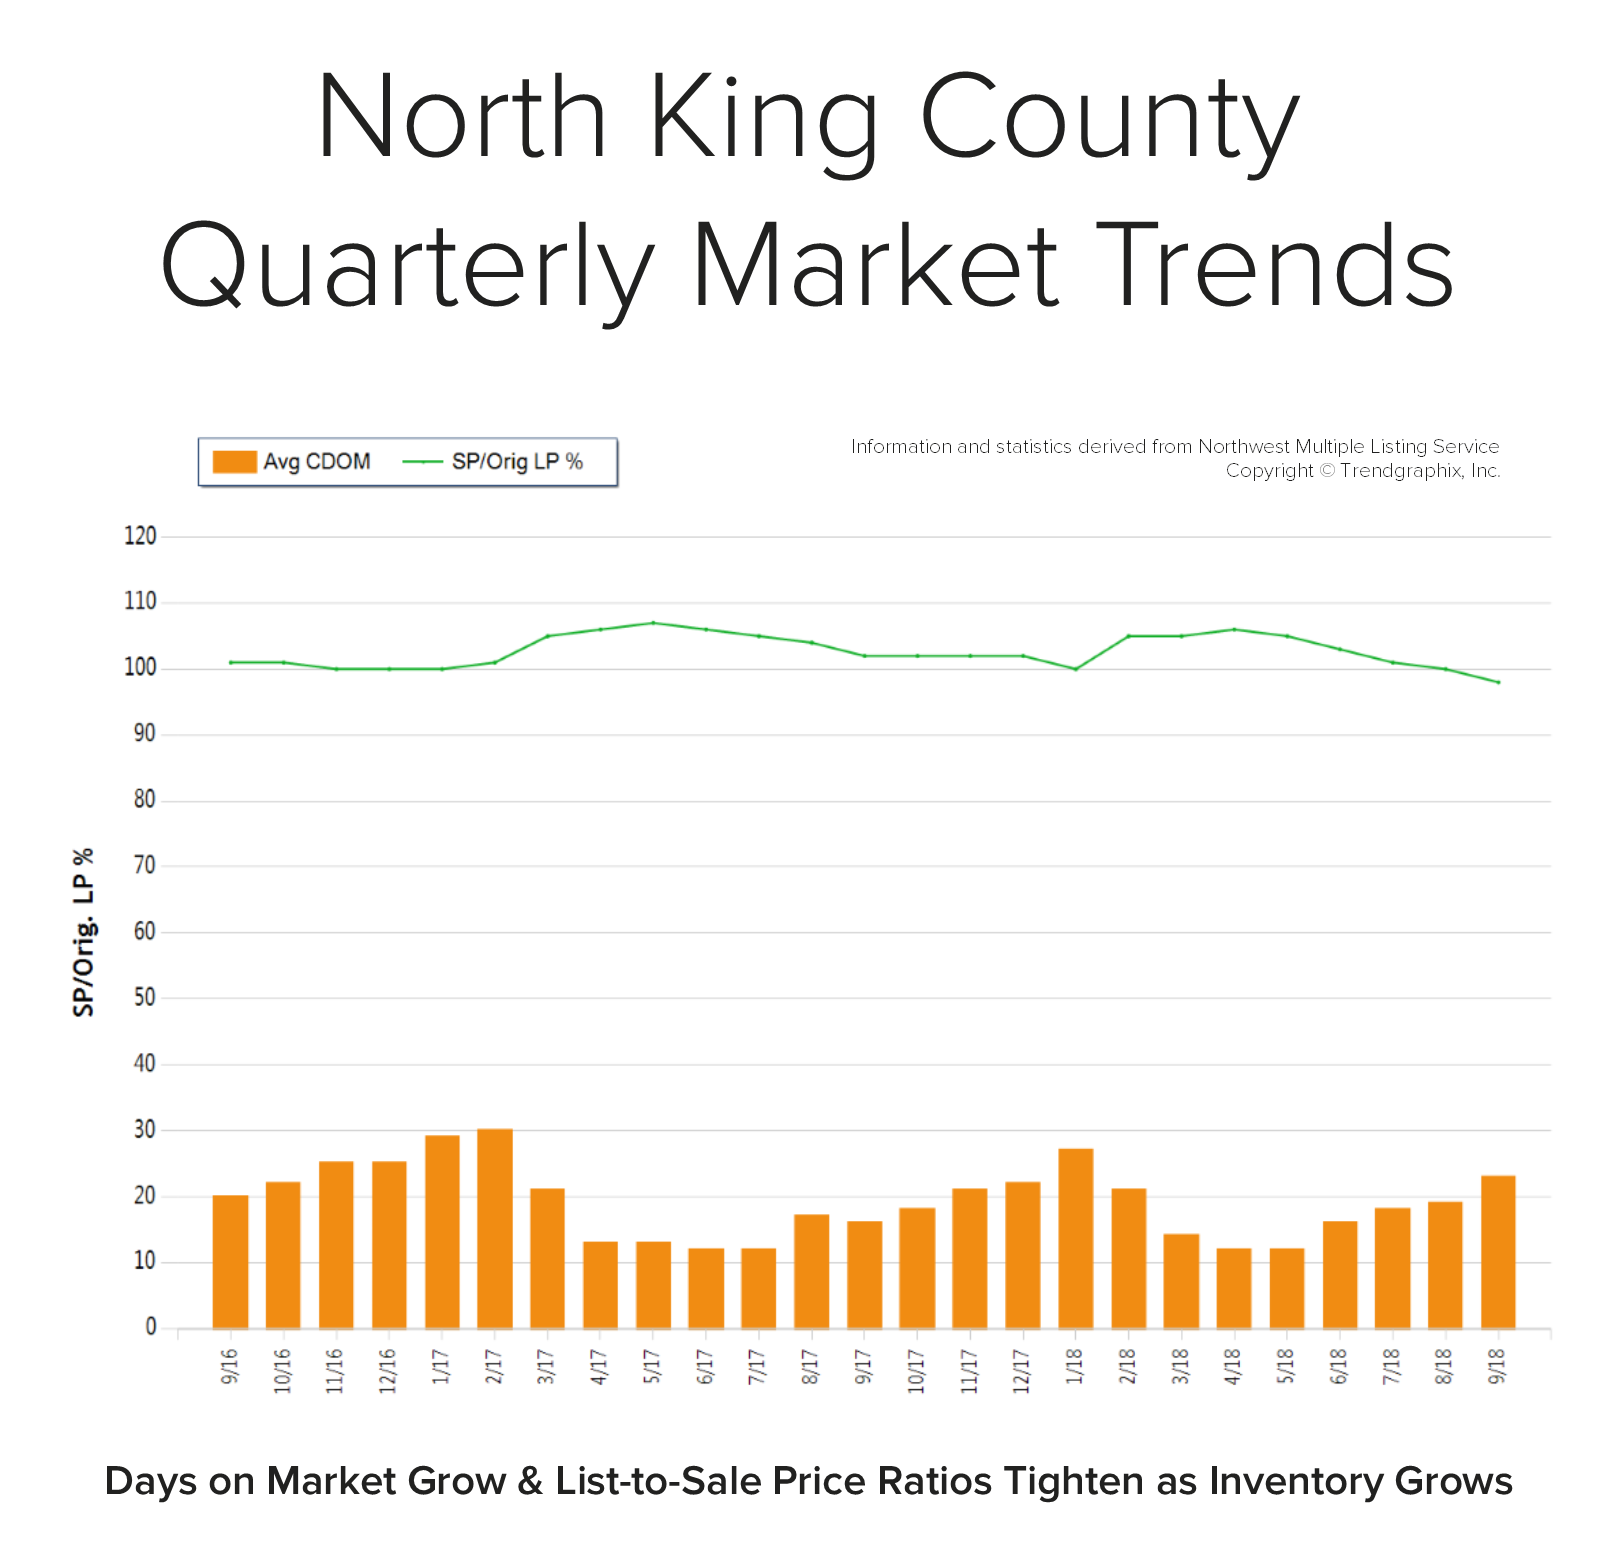
In September, the average days on market landed at 23 days and the original list-to-sale price ratio 98%. Since May, inventory growth has been noticeable, and has given buyers more options. This has led to more negotiations and fewer bidding wars, which is tempering month-over-month price growth to a more sustainable level. Back in April, the average days on market was 12 days and the original list-to-sale price ratio 106%; but months of inventory based on pending sales was 0.8 months, compared to 2.2 months currently. Year-over-year, prices are up 10%, still well above the historical norm of 3%-5% year-over-year gains—but note that the majority of this growth happened during the spring, due to constricted inventory levels.
Supply has increased, creating more options for buyers and helping to buffer affordability issues. Many sellers are deciding to make moves and cash in on the equity gained over the last six years. An average original list-to-sale price ratio of 98% is a positive return, yet illustrates a softening in the market after some very extreme times. With 10% price growth over the last 12-months in a seller’s favor, the increase in selection has led to more nimble moves from one house to another. Where sellers need to be careful is anticipating the month-over-month price growth we saw prior to the shift in inventory. Prospective buyers would be smart to take advantage of today’s historically low interest rates and the added inventory selection.
This is only a snapshot of the trends in north King County; please contact me if you would like further explanation of how the latest trends relate to you.
South Snohomish County Quarterly Market Trends
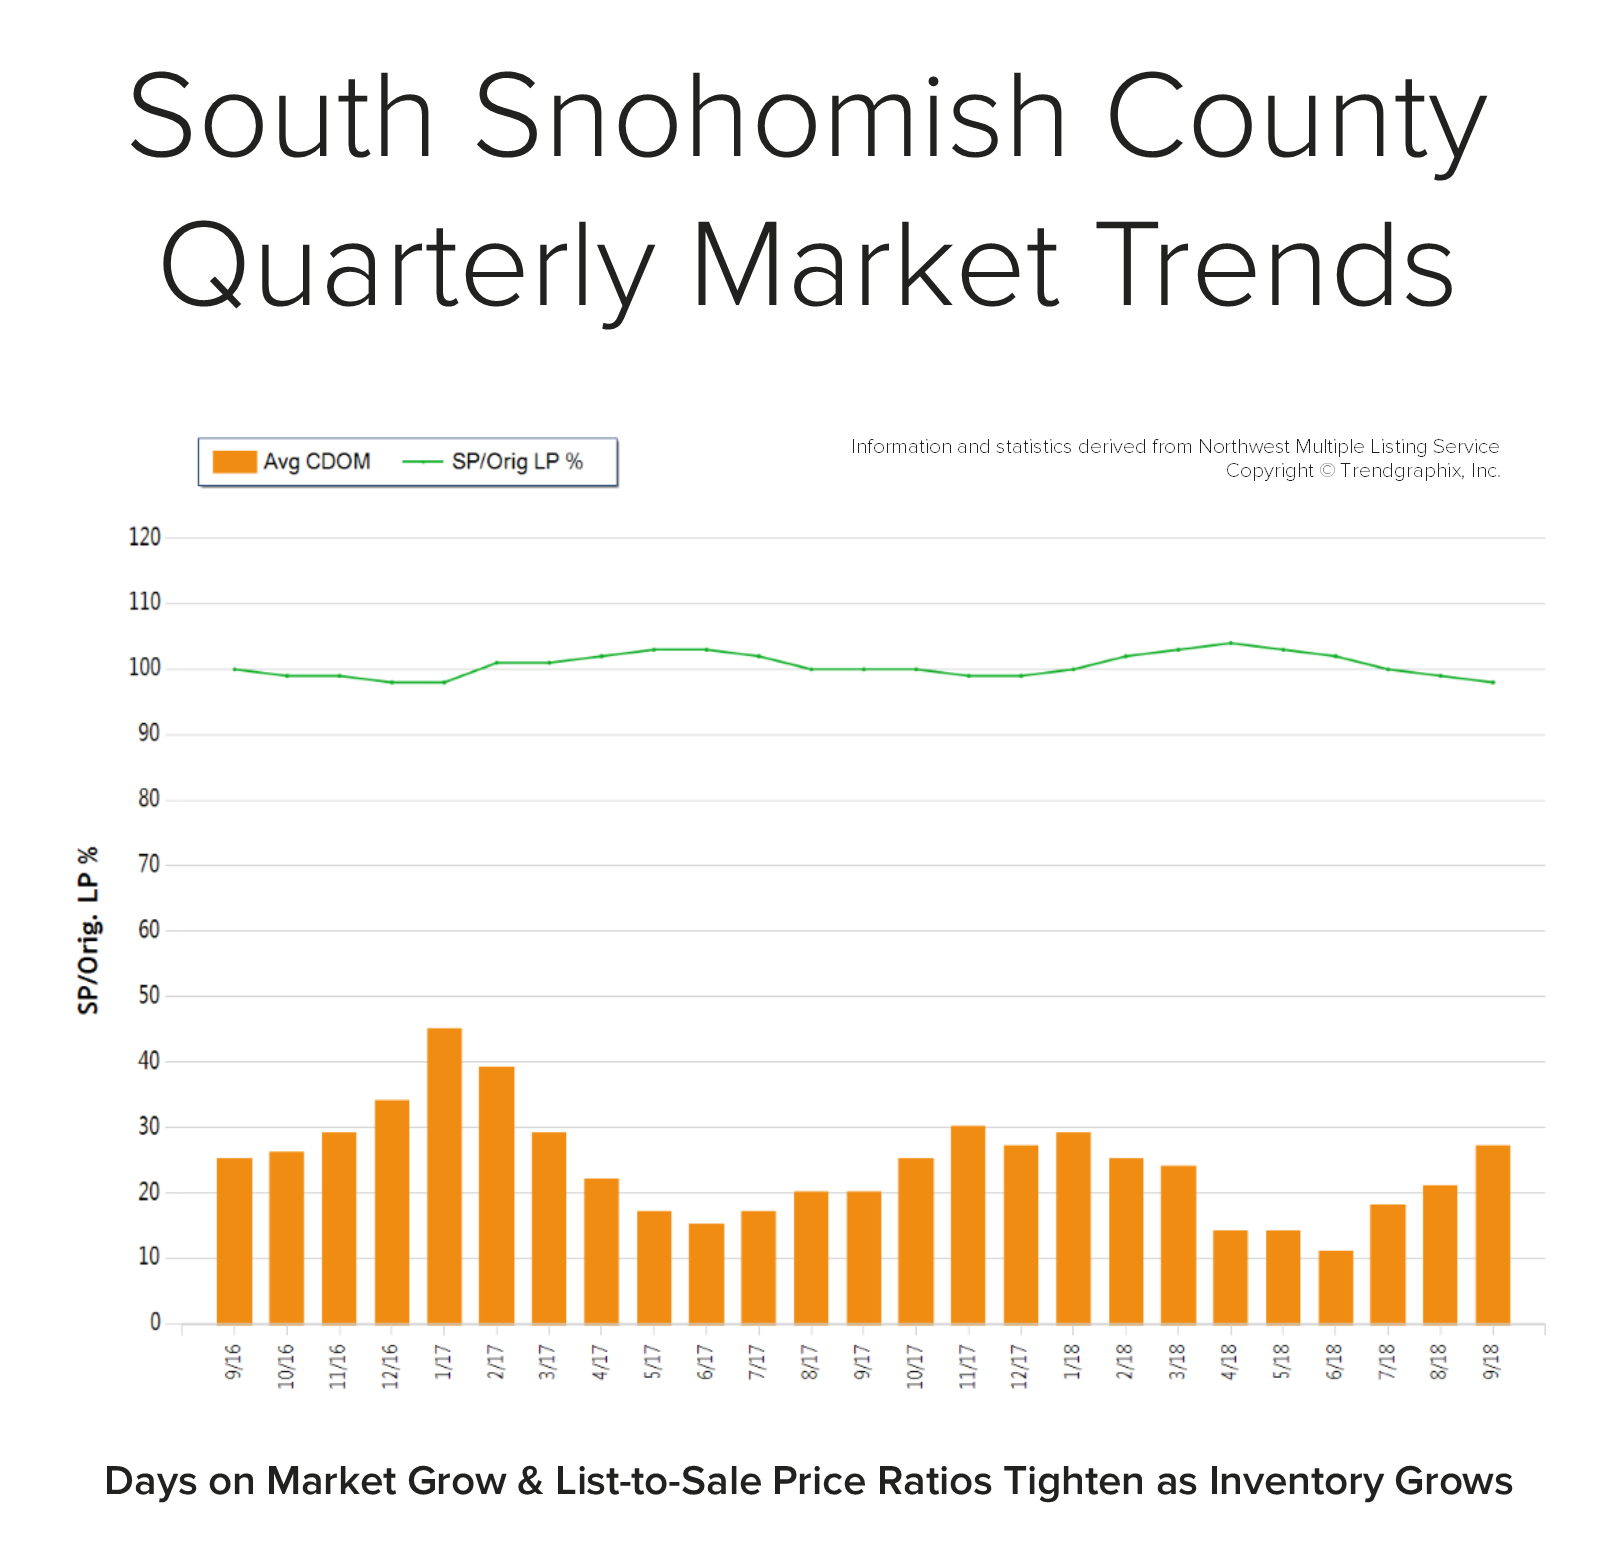
In September, the average days on market landed at 27 days and the original list-to-sale price ratio 98%. Since May, inventory growth has been noticeable, and has given buyers more options. This has led to more negotiations and fewer bidding wars, which is tempering month-over-month price growth to a more sustainable level. Back in April, the average days on market was 14 days and the original list-to-sale price ratio 104%; but months of inventory based on pending sales was 0.8 months, compared to 2.5 months currently. Year-over-year, prices are up 11%, still well above the historical norm of 3%-5% year-over-year gains—but note that the majority of this growth happened during the spring, due to constricted inventory levels.
Supply has increased, creating more options for buyers and helping to buffer affordability issues. Many sellers are deciding to make moves and cash in on the equity gained over the last six years. An average original list-to-sale price ratio of 98% is a positive return, yet illustrates a softening in the market after some very extreme times. With 11% price growth over the last 12-months in a seller’s favor, the increase in selection has led to more nimble moves from one house to another. Where sellers need to be careful is anticipating the month-over-month price growth we saw prior to the shift in inventory. Prospective buyers would be smart to take advantage of today’s historically low interest rates and the added inventory selection.
This is only a snapshot of the trends in south Snohomish County; please contact me if you would like further explanation of how the latest trends relate to you.
North Snohomish County Quarterly Market Trends
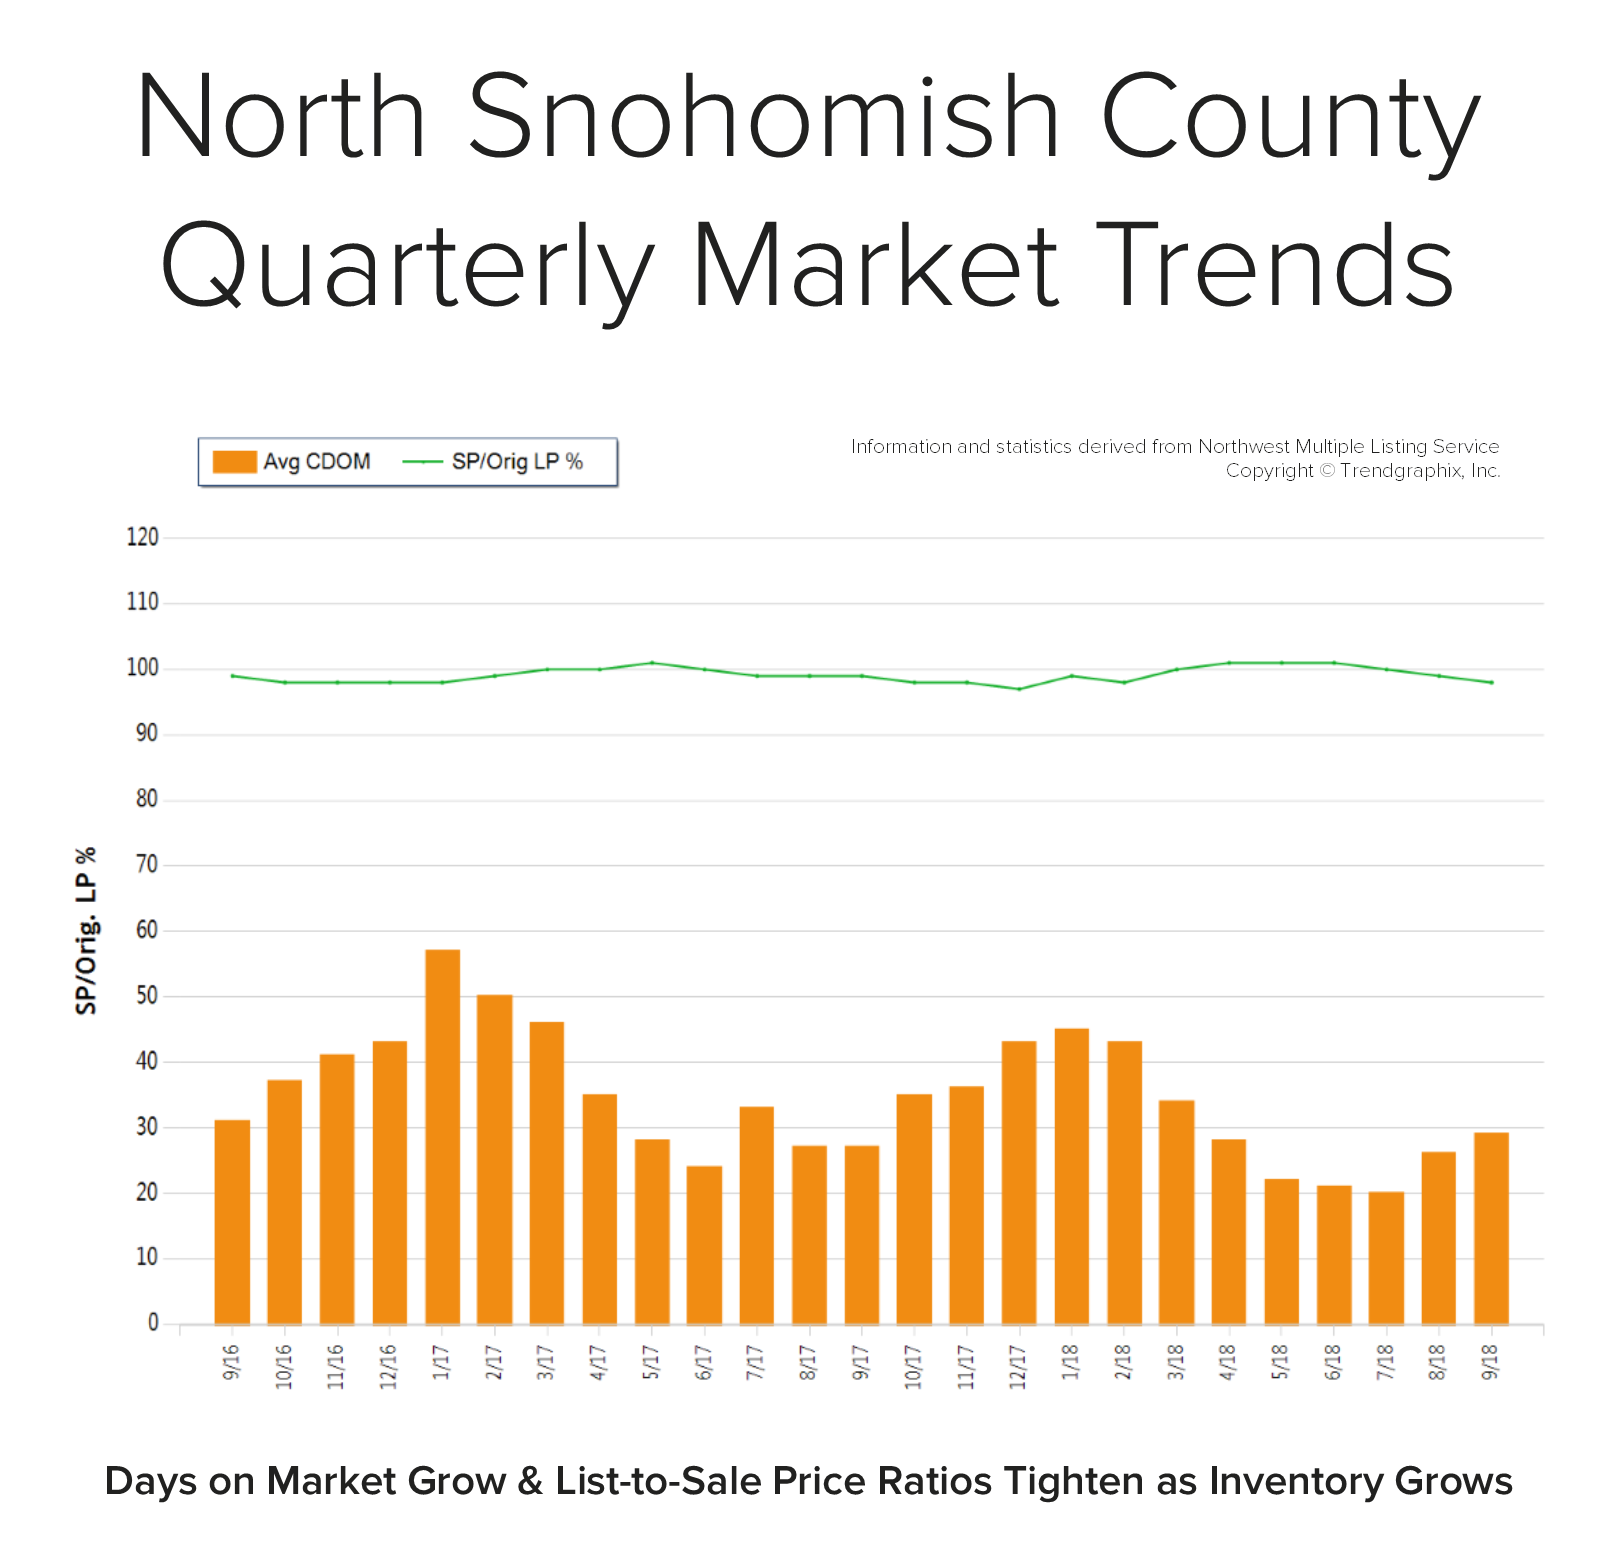
In September, the average days on market landed at 29 days and the original list-to-sale price ratio at 98%. Since May, inventory growth has been noticeable, and has given buyers more options. This has led to more negotiations and fewer bidding wars, which is tempering month-over-month price growth to a more sustainable level. Back in May, the average days on market was 22 days and the original list-to-sale price ratio 101%; but months of inventory based on pending sales was 1 month compared to 2.3 months currently. Year-over-year, prices are up 11%, still well above the historical norm of 3%-5% year-over-year gains—but note that the majority of this growth happened during the spring, due to constricted inventory levels.
Supply has increased, creating more options for buyers and helping to buffer affordability issues. Many sellers are deciding to make moves and cash in on the equity gained over the last six years. An average original list-to-sale price ratio of 98% is a positive return, yet illustrates a softening in the market after some very extreme times. With 11% price growth over the last 12-months in a seller’s favor, the increase in selection has led to more nimble moves from one house to another. Where sellers need to be careful is anticipating the month-over-month price growth we saw prior to the shift in inventory. Prospective buyers would be smart to take advantage of today’s historically low interest rates and the added inventory selection.
This is only a snapshot of the trends in north Snohomish County; please contact me if you would like further explanation of how the latest trends relate to you.
Does it make more sense to rent or own?


The current break-even horizon* in the Seattle metro area is 1.6 years!
*The amount of time you need to own your home in order for owning to be a superior financial decision.
With rising rental rates, historically low interest rates, and home prices on the rise, the advantage of buying vs. renting is becoming clearer each month.
In fact, Seattle has seen some of the sharpest rent hikes in the country over the last year! Snohomish County has seen a huge increase in apartment growth and rising rental rates as well. There are several factors to consider that will lead you to make the best decision for your lifestyle and your financial bottom line. Zillow Research has determined the break-even point for renting vs. buying in our metro area. In other words, the amount of time you need to own your home in order for owning to be a superior financial decision. Currently in Seattle the break-even point is 1.6 years – that is quick! What is so great about every month that ticks away thereafter is that your nest egg is building in value.
I am happy to help you or someone you know assess your options; please contact me anytime.
These assumptions are based on a home buyer purchasing a home with a 30-year, fixed-rate mortgage and a 20 percent down payment; and a renter earning five percent annually on investments in the stock market.
Western Washington Real Estate Market Update – First Quarter 2018


The following analysis of the Western Washington real estate market is provided by Windermere Real Estate Chief Economist Matthew Gardner. We hope that this information may assist you with making better-informed real estate decisions. For further information about the housing market in your area, please don’t hesitate to contact me.
ECONOMIC OVERVIEW
The Washington State economy added 96,900 new jobs over the past 12 months, representing an annual growth rate of 2.9%—still solidly above the national rate of 1.5%. Most of the employment gains were in the private sector, which rose by 3.4%. The public sector saw a more modest increase of 1.6%.
The strongest growth was in the Education & Health Services and Retail sectors, which added 17,300 and 16,700 jobs, respectively. The Construction sector added 10,900 new positions over the past 12 months.
Even with solid increases in jobs, the state unemployment rate held steady at 4.7%—a figure that has not moved since September of last year.
I expect the Washington State economy to continue adding jobs in 2018, but not at the same rate as last year given that we are nearing full employment. That said, we will still outperform the nation as a whole when it comes to job creation.
HOME SALES ACTIVITY
- There were 14,961 home sales during the first quarter of 2018. This is a drop of 5.4% over the same period in 2017.
- Clallam County saw sales rise the fastest relative to the first quarter of 2017, with an increase of 16.5%. In most of the other markets, the lack of available homes for sale slowed the number of closings during this period.
- Listing inventory in the quarter was down by 17.6% when compared to the first quarter of 2017, but pending home sales rose by 2.6% over the same period, suggesting that closings in the second quarter should be fairly robust.
- The takeaway from this data is that the lack of supply continues to put a damper on sales. I also believe that the rise in interest rates in the finalquarter of 2017 likely pulled sales forward, leading to a drop in sales in the first quarter of 2018.

HOME PRICES

- With ongoing limited inventory, it’s not surprising that the growth in home prices continues to trend well above the long-term average. Year-over-year, average prices rose 14.4% to $468,312.
- Economic vitality in the region is leading to robust housing demand that far exceeds supply. Given the relative lack of new construction homes— something that is unlikely to change any time soon—there will continue to be pressure on the resale market. As a result, home prices will continue to rise at above-average rates in the coming year.
- When compared to the same period a year ago, price growth was strongest in Grays Harbor County at 27.5%. Ten additional counties experienced double-digit price growth.
- Mortgage rates continued to rise during first quarter, and are expected to increase modestly in the coming months. By the end of the year, interest rates will likely land around 4.9%, which should take some of the steam out of price growth. This is actually a good thing and should help address the challenges we face with housing affordability—especially in markets near the major job centers.

DAYS ON MARKET
- The average number of days it took to sell a home dropped by seven days when compared to the same quarter of 2017.
- King County continues to be the tightest market in Western Washington, with homes taking an average of 24 days to sell. Every county in the region saw the length of time it took to sell a home either drop or remain essentially static relative to the same period a year ago.
- In looking at the entire region, it took an average of 61 days to sell a home in the first quarter of this year. This is down from 68 days in the firstquarter of 2017 but up by eleven days when compared to the fourth quarter of 2017.
- Anyone expecting to see a rapid rise in the number of homes for sale in 2018 will likely be disappointed. New construction permit activity—a leading indicator—remains well below historic levels and this will continue to put increasing pressure on the resale home market.

CONCLUSIONS

This speedometer reflects the state of the region’s housing market using housing inventory, price gains, home sales, interest rates, and larger economic factors. For the first quarter of 2018, I have left the needle at the same point as fourth quarter of last year. Price growth remains strong even as sales activity slowed. All things being equal, 2018 is setting itself up to be another very good year for sellers but, unfortunately, not for buyers who will still see stiff competition for the limited number of available homes for sale.

Mr. Gardner is the Chief Economist for Windermere Real Estate, specializing in residential market analysis, commercial/industrial market analysis, financial analysis, and land use and regional economics. He is the former Principal of Gardner Economics, and has more than 30 years of professional experience both in the U.S. and U.K.
Eastside Quarterly Market Trends
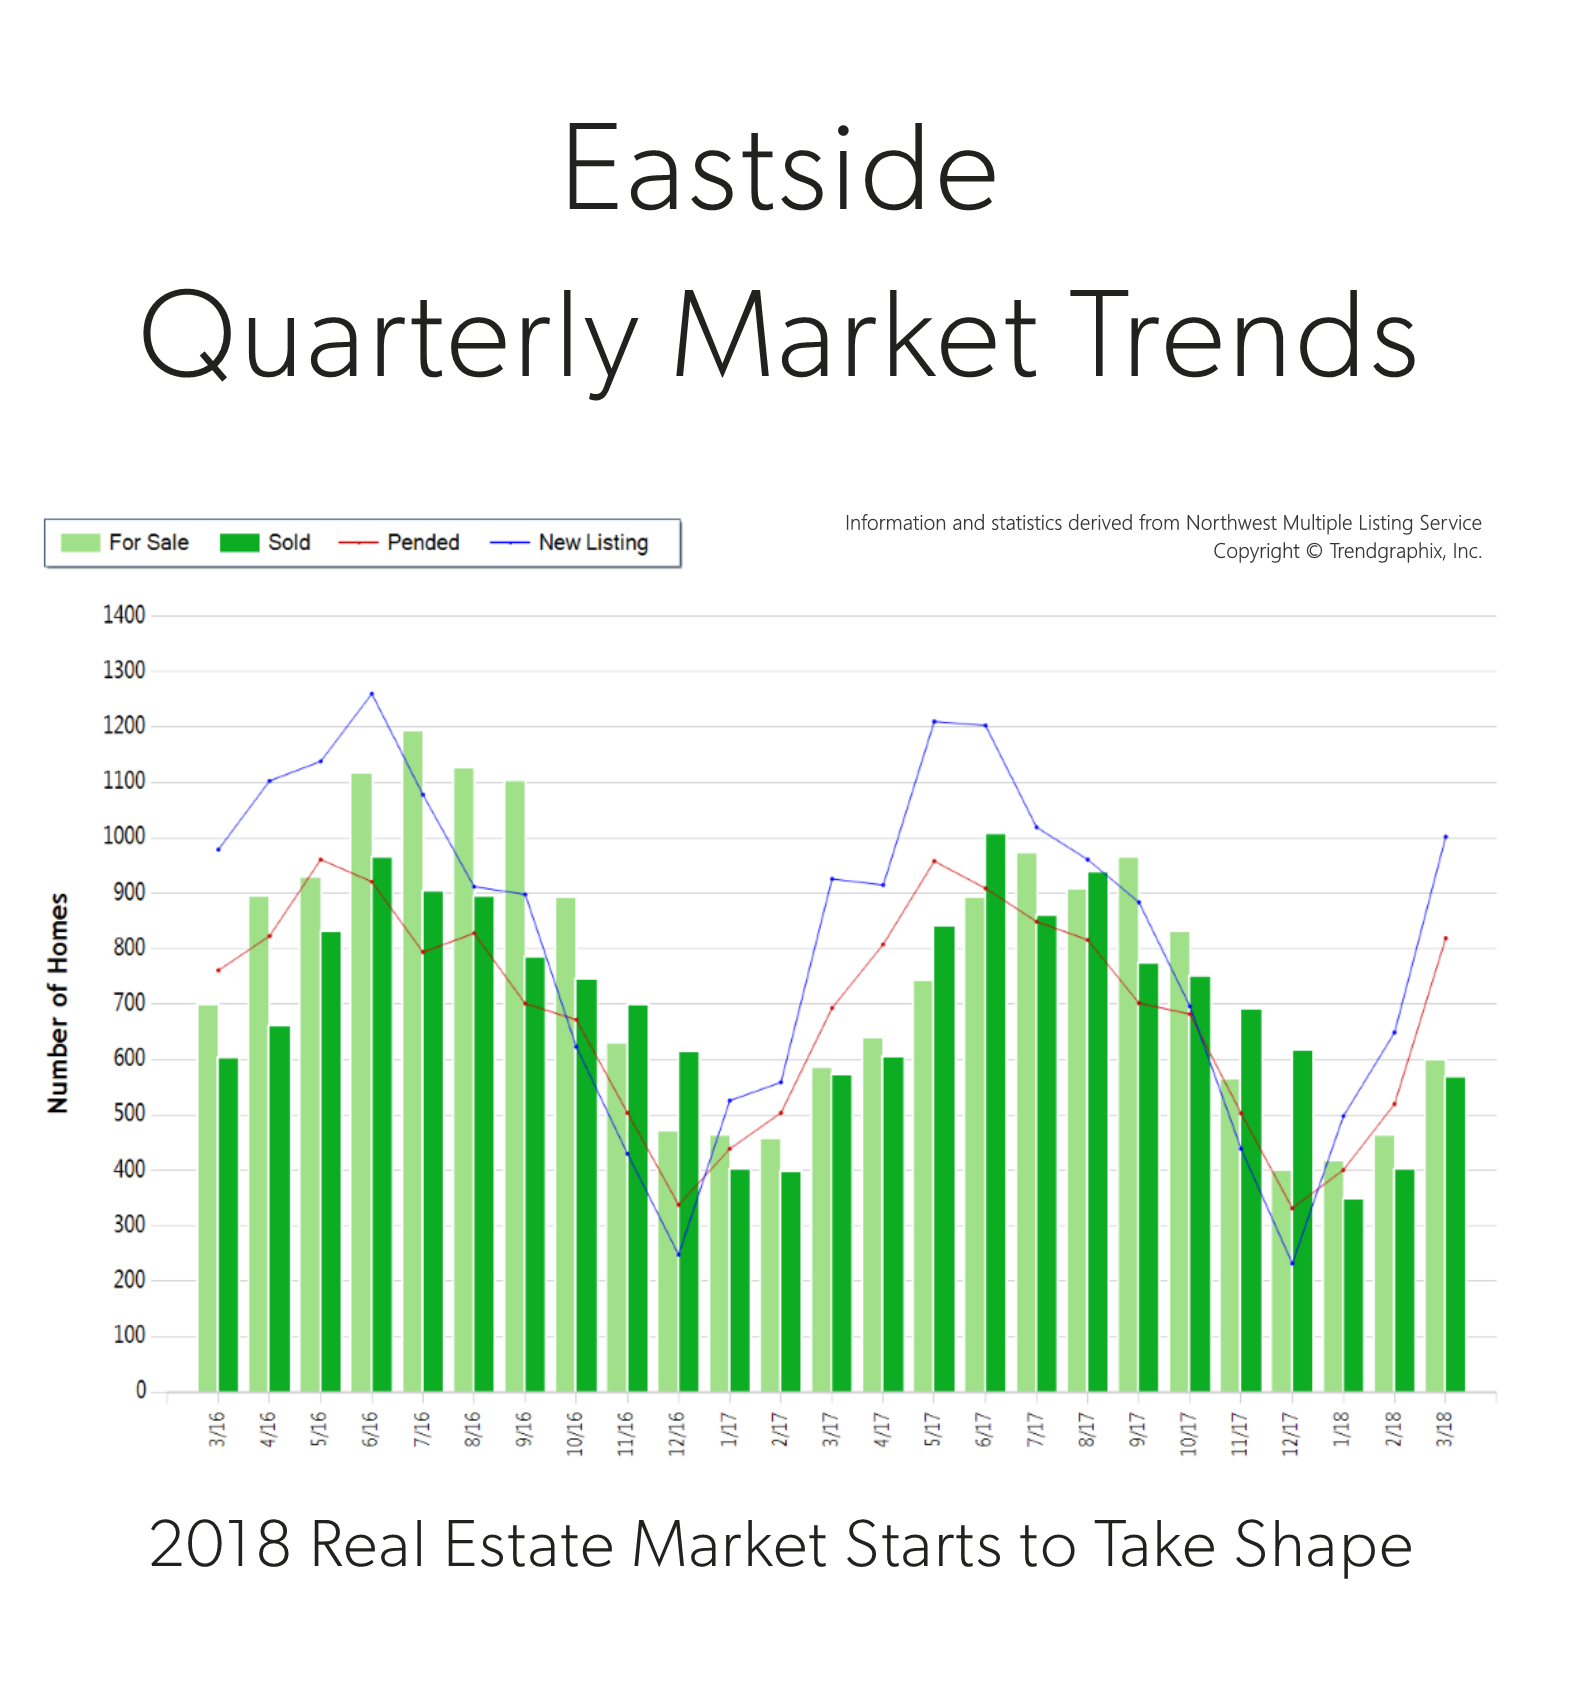
 It is the time of year when our market starts to take off. Spring is here and we are starting to see seasonal increases in inventory. In fact, there was a 54% increase in new listings in March compared to February. That increase was topped by a 58% rise in pending sales, illustrating very strong demand for housing in your area. Last month, the average list-to-sale price ratio (the amount the sale price topped the list price) was 103%, indicating that multiple offers were the norm. We ended the quarter with 0.7 months of inventory – the lowest level yet. More inventory would be absorbed by happy buyers looking for more selection and would help temper price growth, which is up 14% year-over-year.
Eastside real estate has a very high premium due to close-in commute times and desirable neighborhoods. In fact, the median price in March was $927,000! Sellers are enjoying amazing returns due to this phenomenon, and buyers are securing mortgages with minor debt service due to low interest rates. This is a very strong seller’s market, but buyers who are securing a home are already enjoying appreciation in equity.
This is only a snapshot of the trends on the Eastside area; please contact me if you would like further explanation of how the latest trends relate to you.
A Love Letter to Buyers


I hope your Valentine’s Day was a sweet one, but it got me thinking. I am often sharing with you the advantages of this market for home sellers, which is unbelievably positive. With that said, I thought I’d take some time to give the potential buyers in our marketplace some love, hope, and of course, data!
Dear Greater Seattle Home Buyer,
Let’s just be up front: buying a home in today’s market is not easy. Quite frankly, it can be a wild roller coaster ride with twists and turns; but remember, folks pay a lot of money and stand in long lines for roller coaster rides. Imagine the excited pit in your stomach as the cart clicks up to the highest point before you plunge down a steep drop, and the thrill of raising your hands up because you trust that you are going to be okay. These emotions also accurately reflect the feelings of today’s home buyer – it can be a wild ride! Let’s also note that many roller coaster riders return to the back of the line right after getting off. Home ownership is also a good exercise to repeat and is often the investment that leads to the most built wealth in one’s life.
So how does one ensure that they are not the Nervous Nelly who stands in line for over an hour, finally makes it to the front to be strapped in to the cart, but who then chooses to bow out? The one that sits on the sidelines watching others throw up their hands with a thrill in their eye; the one with that tinge of regret as their friends rejoin them back on hallowed ground to recount their adventure. Wow, this is getting dramatic! Here are a few tips to follow that will ensure that one can find success securing a home in today’s market and get on the equity building train.
Waiting is Even More Expensive
In 2017, the year-over-year median price gains across our region were strong. In fact, here is a little break down.
| North Snohomish County: | $371,000 | up 13% |
| South Snohomish County: | $508,000 | up 14% |
| North King County: | $715,000 | up 14% |
| Seattle Metro: | $710,000 | up 15% |
| South King County: | $405,000 | up 13% |
| Eastside: | $865,000 | up 15% |
This aspect is actually one to pay very close attention to. We have been amazingly spoiled with historically low interest rates over the last five years. In fact, there is an entire generation of buyers who only know rates that have hovered from 3.5 – 4.5% – that is close to 3 points under the 30-year average! A good rule of thumb regarding interest rates, is that for each 1-point increase a buyer loses 10% of their buying power. That means that if you have a $500,000 budget and the rate goes up by a point, that you are now shopping for a $450,000 house if you want the same payment. Note, that shift does not take appreciation into consideration. Today’s rates have helped buyers bear the home prices in our area. It is predicted that rates will rise in 2018 by .5 to 1%.Rents are High and Don’t Build Wealth
Seattle is now the 5th most expensive city to rent in the country according to the US Census Bureau. With rising rental rates, still historically low interest rates, and home prices on the rise, the advantage of buying versus renting has become clear for folks who have a down payment saved, good debt-to-income ratios and strong credit. Currently, the breakeven horizon (the amount of time you need to own your home in order for owning to be a superior financial decision vs. renting) in the Greater Seattle area is 1.6 years according to Zillow research.
Partner with a Broker Who Will Get the Job Done
A broker that has a process is key! It starts with an initial buyer consultation. I liken the buyer consultation to the seat belt you would wear on the roller coaster ride. When you go to the Dr. they start with your intake, check your vitals, ask questions, etc. The buyer consultation aims to unearth a buyer’s goals, research the areas they are interested in, address financing, and illustrate the challenges of the environment, so one can be successful. Time is money, and this consultation brings clarity, efficiency and trust. This upfront education coupled with a high level of communication and availability is paramount. The depth of the relationship will lead to success, and is the ingredient that enables a buyer to throw up their hands and take the thrilling plunge. It is hard to do that without a seat belt!
Get Your Finances in Order
Aligning with a trusted real estate professional is key, but so is aligning with a reputable and responsive mortgage lender. Getting pre-approved is the minimum, but getting pre-underwritten is a game changer. Finding a lender that is willing to put in the work up-front to vet credit, income, savings, debt, and all other financial indicators will lead to being pre-underwritten, which listing agents and sellers appreciate! Also, be aware that you do not always need to have a huge down payment to make a purchase work. Employment, assets, credit, and what you have saved all work into your ability to acquire a loan. I have seen plenty of people secure a home with 3-5% down. Education and awareness create clarity, and investing into understanding your financial footing equals empowered and more efficient decisions. Note that I mentioned “responsive”. This is a 24/7 market, and lenders who don’t work evenings and weekends can get in the way of a buyer securing a home. If you need a short list of lenders that fit this description, please contact me.
‘Tis the Season – Inventory is Coming
Have hope! This is the time of year where we see inventory climb month over month. There will be more selection, but bear in mind it is also the time of year that the appreciation push happens. If you are feeling 75-80% in love with a home, it is one to act on. You’re never going to “get it all”, so a willingness to focus on priorities will pay off, because waiting will have an expense.
If you or someone you know is considering a purchase in today’s market, please contact me. It is my pleasure to take the time to educate, devise a plan, and help buyers find success in a challenging, yet advantageous market.
