COVID-19 & the Real Estate Market – where we are now

 |
|
|
|
|
|
|
|
|
|
Monthly Newsletter – March 2020: COVID-19 & the Real Estate Market: Real Time Numbers from the Front Lines

Things are changing rapidly these days, and if I had a dollar for how many times I have said “one day-at-a-time” over the last two weeks, I’d have a nice stack of cash. There are lots of questions swirling about simple everyday life and big life decisions like buying and selling real estate. I’m a believer in studying the numbers and sharing that data. It has always been my practice in my business to provide my clients with the information they need to help empower their decisions. With that said, I did a real-time pull of numbers on 3/18/20 in order to gain some understanding of the current trends amongst the COVID-19 outbreak.
I pulled three different market areas: Lake Stevens (North Snohomish County), Lynnwood (South Snohomish County) and Shoreline (North King County). I felt this would give a good representation of some different geographical markets and would avoid making any sweeping observations.
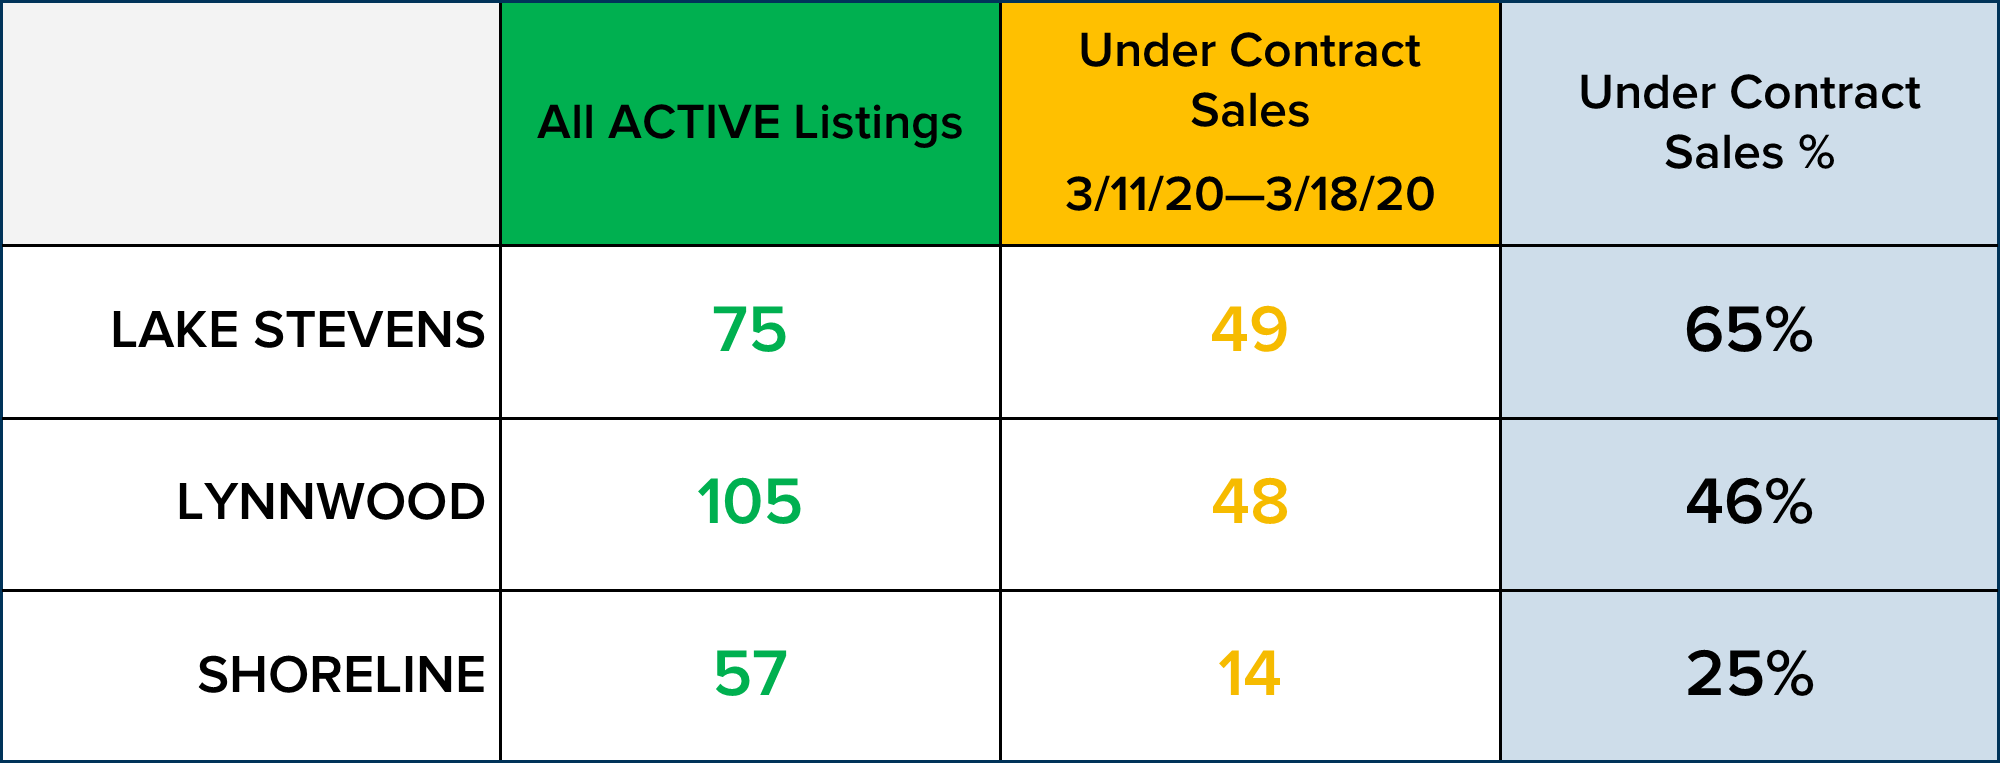
Below is an accounting of all of the active listings on the market in each of these cities along with all of the sales that went under contract from 3/11/20 to 3/18/20 (pulled around 1:30 pm PST) and the percentage relationship between those numbers. As you can see, we have had quite a bit of sales activity over the last week. Schools shut down through April 24th on 3/12/20 and restaurants and bars closed for dine-in business on 3/16/20, and homes continued to sell. We are certain that the historically low interest rates are fueling this demand. As of 3/17/20, the rate for a conventional, conforming loan was right around 3.5 – 3.65%.
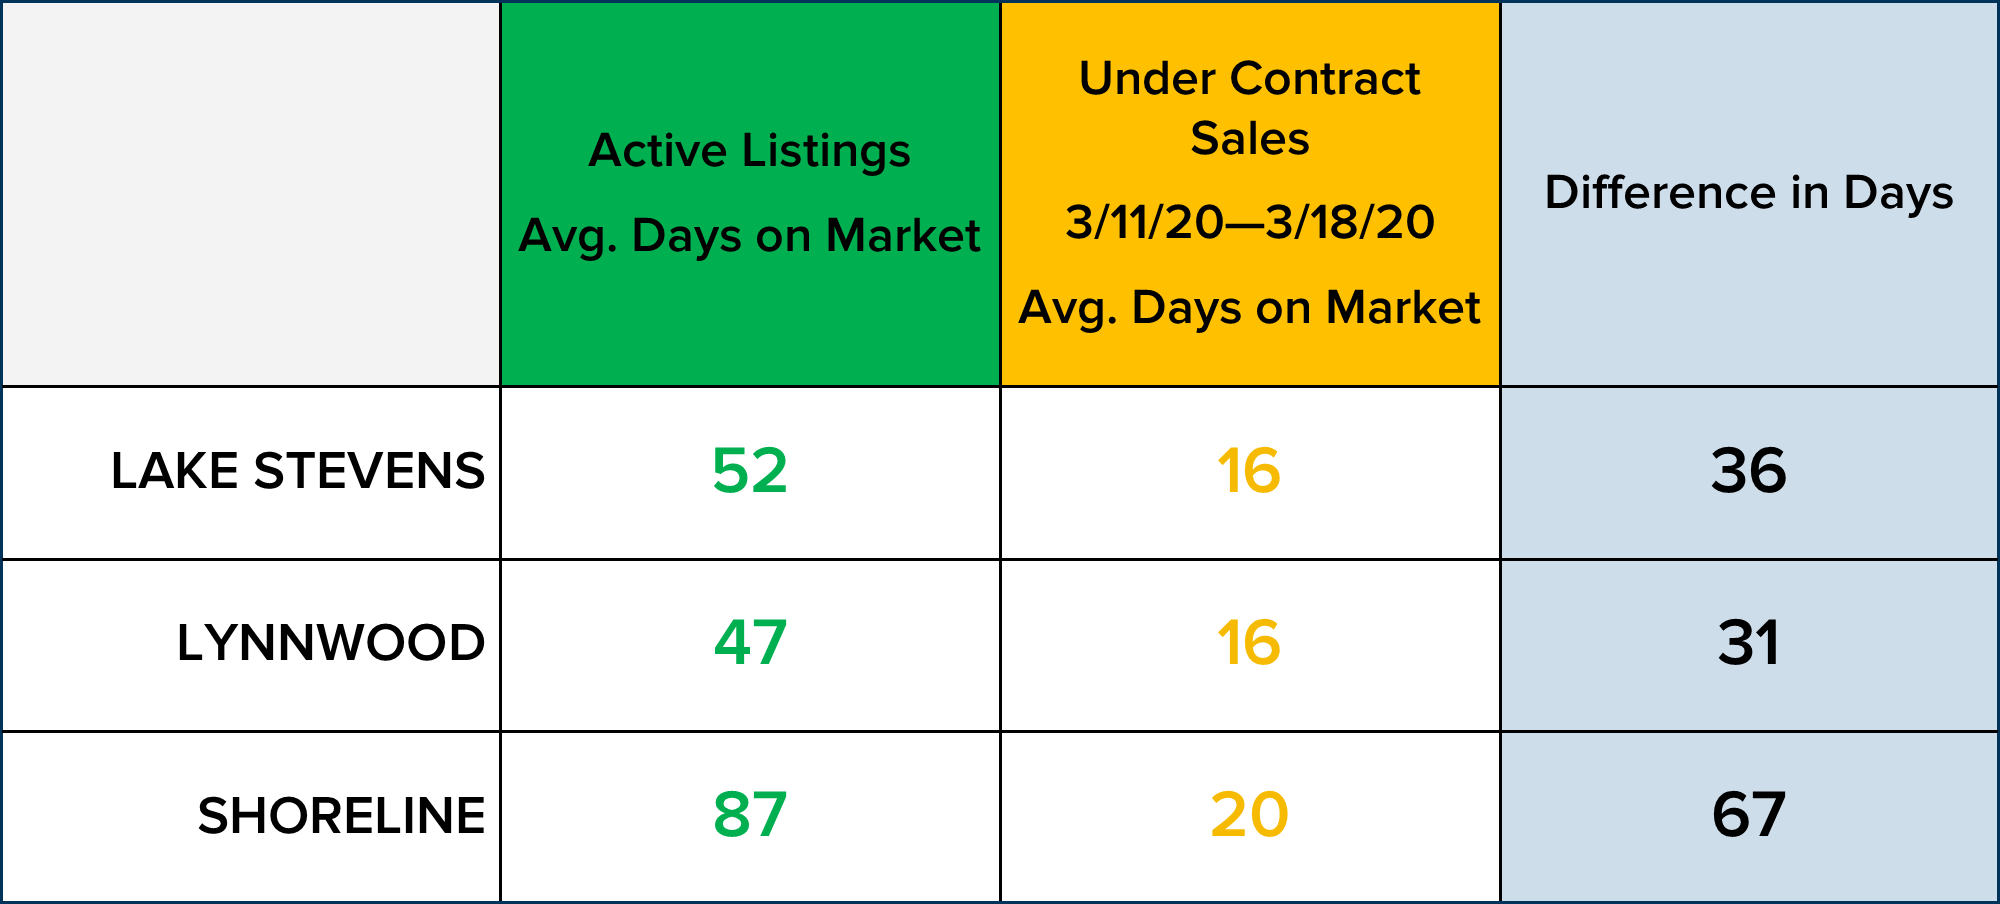
Below you can see a chart that reports the average days on market for the homes that are currently active and the homes that went under contract over the last week. The average days on market for the homes that were absorbed over the last week were markedly shorter, indicating that the homes that sold were newer to the market, well-presented, and appropriately priced. The longer market times for the actives indicate possible overpricing, as the average days on market for the month of February were 27 for Lake Stevens, 53 for Lynnwood, and 50 for Shoreline. This also shows a trend for March average days on market to be shorter than February.
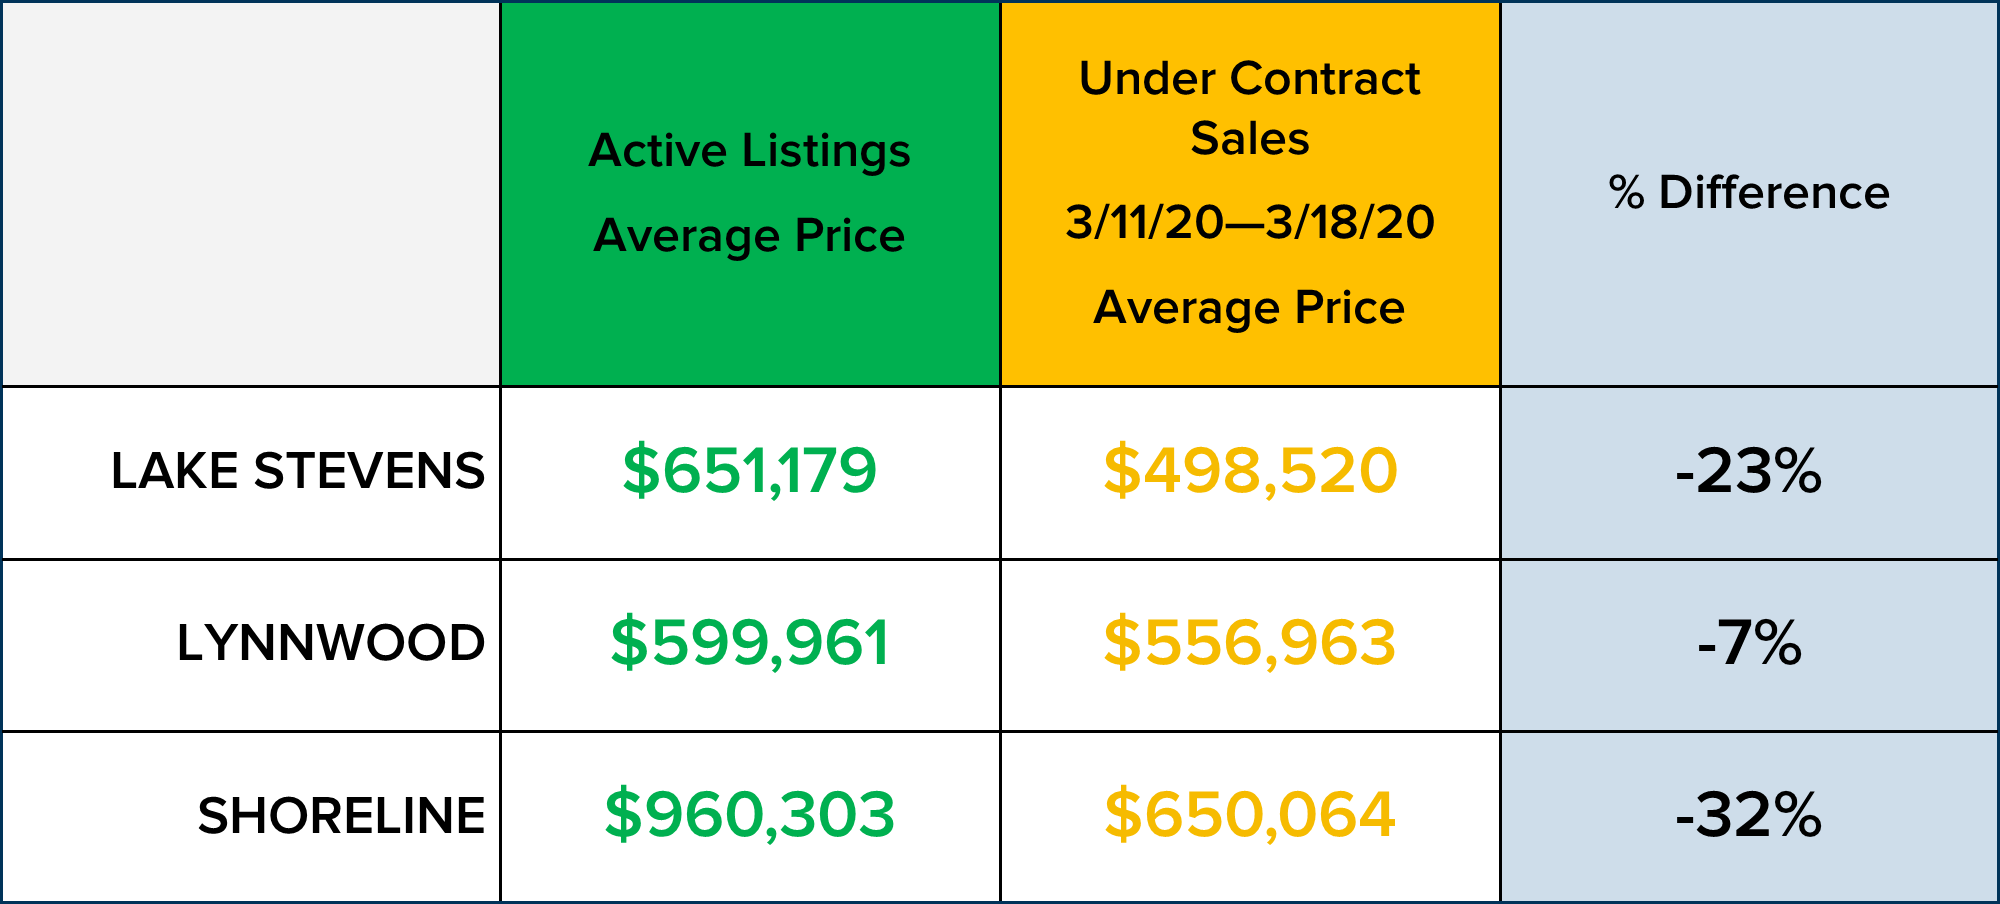
The last set of data that I pulled below is the average prices of the active listings and the average prices of the homes that went under contract last week. These percentage differences are in line with a similar comparison from February. In February, the percentage difference in the average active list price to the sold price was -22% in Lake Stevens, -9% in Lynnwood, and -29% in Shoreline. Since the under-contract sales have not published a closed sale price yet, we cannot take into consideration if there were any escalations above the list price. With the shorter-than-normal days on market and the stories I am hearing on the front lines of multiple offers, I believe we will have some escalations reported once these transactions close. I am sure there will be some concessions reported as well.
You may be wondering if this is still a good time to buy or sell, and the answer to that is different for each person. What I can say with certainty is that I am committed to bringing current facts and statistics to our conversations, and answering your questions as best I can. I hope you found the above figures to be encouraging, I did! Real estate is a cyclical business, and although the current economic shifts may be unsettling, we have weathered these cycles before. At this moment, record-low interest rates and low inventory are creating continued demand for homes, and from the figures reported, homes are going under contract. This is what I know today, and I felt it was worth sharing.
Below is a video from Windermere’s Chief Economist, Matthew Gardner that was released on Monday, 3/16/20 assessing the fate of the Greater Seattle real estate market during this time. Please contact me with your questions and concerns, I am here to help keep you informed!
Be well!
At this time, we are still planning to hold our annual Shred Event and Food Drive on April 18th. We will update you if anything changes due to crowd requirements and your safety.
This event will be vitally necessary to help stock our local food bank, which is struggling to meet demands. We also know that since many of you are staying home for extended periods of time, you will be cleaning and organizing, and will need the shredding services come April. We hope to meet these needs and bring our community together in a safe way.
Celebrate Earth Day with us! We are partnering with Confidential Data Disposal for our 9th year; providing you with a safe, eco-friendly way to reduce your paper trail and help prevent identity theft.
Saturday, April 18th, 10AM to 2PM
4211 Alderwood Mall Blvd, Lynnwood
Bring your sensitive documents to be professionally destroyed on-site. Limit 20 file boxes per visitor.
We will also be collecting non-perishable food and cash donations to benefit Concern for Neighbors food bank. Donations are not required, but are appreciated.
Hope to see you there!
**This is a Paper-Only event. No x-rays, electronics, recyclables, or any other materials
One of the most important lessons I’ve learned is the power of mindset. It is proven that what you focus on, expands. Setting aside time every day to focus on gratitude has been hugely beneficial in my business as well as my personal life, and I am finding this discipline to be even more important in today’s uncertain world. We are surrounded with scary news, unprecedented government announcements, and a whole lot of uncertainty. We are in uncharted territory, but the one thing we do have control over, is our own mindset.
Here are a few practical ideas to foster positivity in your life.
Daily Gratitudes. Carve out just a few minutes every day to write down two or three things you are grateful for. Make this part of your morning routine to help center yourself before the day begins, or part of your evening routine to help calm your mind before bed.
Savor small moments. No matter what situation you find yourself in, there are still many small moments to be enjoyed. The smell of coffee in the morning, or the quiet house in the evening when the children are all asleep. A hot shower or a luxurious lotion. Don’t rush through these. Stop and take a moment to really enjoy.
Look to the past. Humans are resilient. You have weathered uncertain times before, perhaps during the Great Recession, 9/11, or a major natural disaster. You made it through those, and you are stronger and better for the experience. Take a moment to look back at all you have been through as a reminder of your own resilience.
Follow social media accounts that provide good news only. There is quite a bit of doom and gloom out there right now. In addition to watching some funny YouTube videos or some heart-warming animal stories on Facebook, make sure you are plugged in and following some accounts that are all good, all the time. Some good ones on Facebook are
@GoodNewsGMA
@TanksGoodNews
@GoodNewsMove
If you’re on Instagram, be sure to check out
@Good
@UpWorthy
@TanksGoodNews
@GoodNews_Movement
Take social media breaks. This will be important. Not only because social media can be a hotbed of misinformation, but it can also provide an overload of general information. Many people are beginning to feel overwhelmed with the sheer amount of news, suggested kids activities, and overall noise happening on all social channels right now. Take some time every day to be intentional about closing these apps, putting your phone or laptop away, and focusing your attention on something else. #DigitalDetox
Above all, be deliberate with integrating positivity into your daily life, knowing that together, we will get through this.
If you have ideas of how to stay positive, please share them with me!
Monthly Newsletter – February: Interest Rates Bottom Out, Sparking High Buyer Demand

Most recently, we have experienced an uptick in market activity. In fact, King County saw a 35% increase in pending sales from December to January, and Snohomish County 38%. The seasonal uptick from the holidays to the New Year is normal, but it was quite sizable. This is reinforced by a 6% increase in pending activity this January over last January in King County, and a 10% increase in Snohomish County. This increase is being driven by multiple factors, such as our thriving economy and growing job market, generational shifts and historically low interest rates.
Currently, rates are as low as 3.5% for a 30-year fixed conventional mortgage – 1 point down from the fourth quarter of 2019. Moreover, the interest rate is down 1.75 points from 2 years ago. These levels are unprecedented! The current rates are as low as they have been in 3 years. This is meaningful because the rule of thumb is that for every one-point decrease in interest rate, a buyer gains ten percent in purchase power. For example, if a buyer is shopping for a $500,000 home and the rate decreases by a point during their search, the buyer could increase their purchase price to $550,000 and keep the same monthly payment.
Why is this important to pay attention to? Affordability! The Greater Seattle area is not an inexpensive place to own a home; we have seen strong appreciation over the last 7 years due to the growth of the job market and overall economy. The interest rate lasts the entire life of the loan and can have a huge impact on the monthly cash flow of a household. This cost savings is also coupled with a balancing out of home-price appreciation. Complete year-over-year, prices are flat in King County and up around 3% in Snohomish County. Note that from 2018 to 2019 we saw an 8% increase in prices in both King and Snohomish Counties. Price appreciation is adjusting to more normal levels and is predicted to increase 5-7% in 2020 over 2019.
As we head into the spring market, the time of year we see the most inventory become available, the interest rates will have a positive influence on both buyers and sellers. Naturally, buyers will enjoy the cost savings, but sellers will enjoy a larger buyer pool looking at their homes due to the opportunities the lower rates are creating. Further, would-be sellers who are also buyers that secured a rate as low as 3.75% via a purchase or refinance in 2015-2017, will consider giving up that lower rate for the right move-up house now that rates would be a lateral move or possibly even lower.
This recent decrease in rate is making the move-up market come alive. Baby Boomers and Gen X’er’s are equity rich and able to make moves to their next upgraded home or fulfill their retirement dreams. What is great about this, is that it opens up inventory for the first-time buyer and helps complete the market cycle. First-time buyers are abundant right now as the Millennial generation is gaining in age and making big life transitions such as getting married, starting families, and buying real estate.
Will these rates last forever? Simply put, no! Right now is a historical low, and depending on economic factors rates could inch up. According to Matthew Gardner, Windermere’s Chief Economist, rates should hover around 4% throughout 2020. While still staying well below the long-term average of 7.99%, increases are increases, and securing today’s rate could be hugely beneficial from a cost-saving perspective. Just like the 1980’s when folks were securing mortgages at 18%, the people that lock down on a rate from today will be telling these stories to their grandchildren. Note the long-term average – it is reasonable to think that rates closer to that must be in our future at some point.
So what does this mean for you? If you have considered making a move, or even your first purchase, today’s rates are a huge plus in helping make that transition more affordable. If you are a seller, bear in mind that today’s interest rate market is creating strong buyer demand, providing a healthy buyer pool for your home. As a homeowner who has no intention to make a move, now might be the time to consider a refinance. What is so exciting about these refinances, is that it is not only possible to reduce your monthly payment, but also your term, depending on which rate you would be coming down from. There are some pretty exciting money saving opportunities for people to take advantage of right now.
If you would like additional information on how today’s interest rates pertain to your housing goals, please contact me. I would be happy to educate you on homes that are available, do a market analysis on your current home, and/or put you in touch with a reputable mortgage professional to help you crunch numbers. Real estate success is rooted in being accurately informed, and it is my goal to help empower you to make sound decisions for your lifestyle and investment.
Celebrate Earth Day with us! We are partnering with Confidential Data Disposal for our 9th year; providing you with a safe, eco-friendly way to reduce your paper trail and help prevent identity theft.
Saturday, April 18th, 10AM to 2PM
4211 Alderwood Mall Blvd, Lynnwood
Bring your sensitive documents to be professionally destroyed on-site. Limit 20 file boxes per visitor.
We will also be collecting non-perishable food and cash donations to benefit Concern for Neighbors food bank. Donations are not required, but are appreciated.
Hope to see you there!
**This is a Paper-Only event. No x-rays, electronics, recyclables, or any other materials.
It’s a great time to begin preparing your home for spring. Here are a few general home maintenance tips to consider this time of year.
- Clean the kitchen exhaust hood & filter.
- Replace the furnace filter. It may be especially filthy after the winter months.
- Inspect the roof for water damage. It’s also a good idea to check any fences, carports and sheds. TIP: check the south end of your roof first; it is the first to show wear.
- Test the batteries in all smoke and carbon monoxide detectors.
- Clear the gutters of any buildup to allow for proper functioning.
- Start the grass revival cycle by aerating, thatching and fertilizing.
- Be sure no inside or outside vents are blocked by fallen debris.
- Clean the windows and screens. Repair any holes in screens or replace them if needed.
- Inspect and repair siding and peeling paint. Fix or replace damaged siding. Strip peeling paint and replace it with a new coat.
- Check the basement for water damage. Pay attention to musty smells, water stain and damp surfaces.
- Invest in a carbon monoxide detector – every home should have at least one.
South King County Quarterly Market Trends – Q4 2019
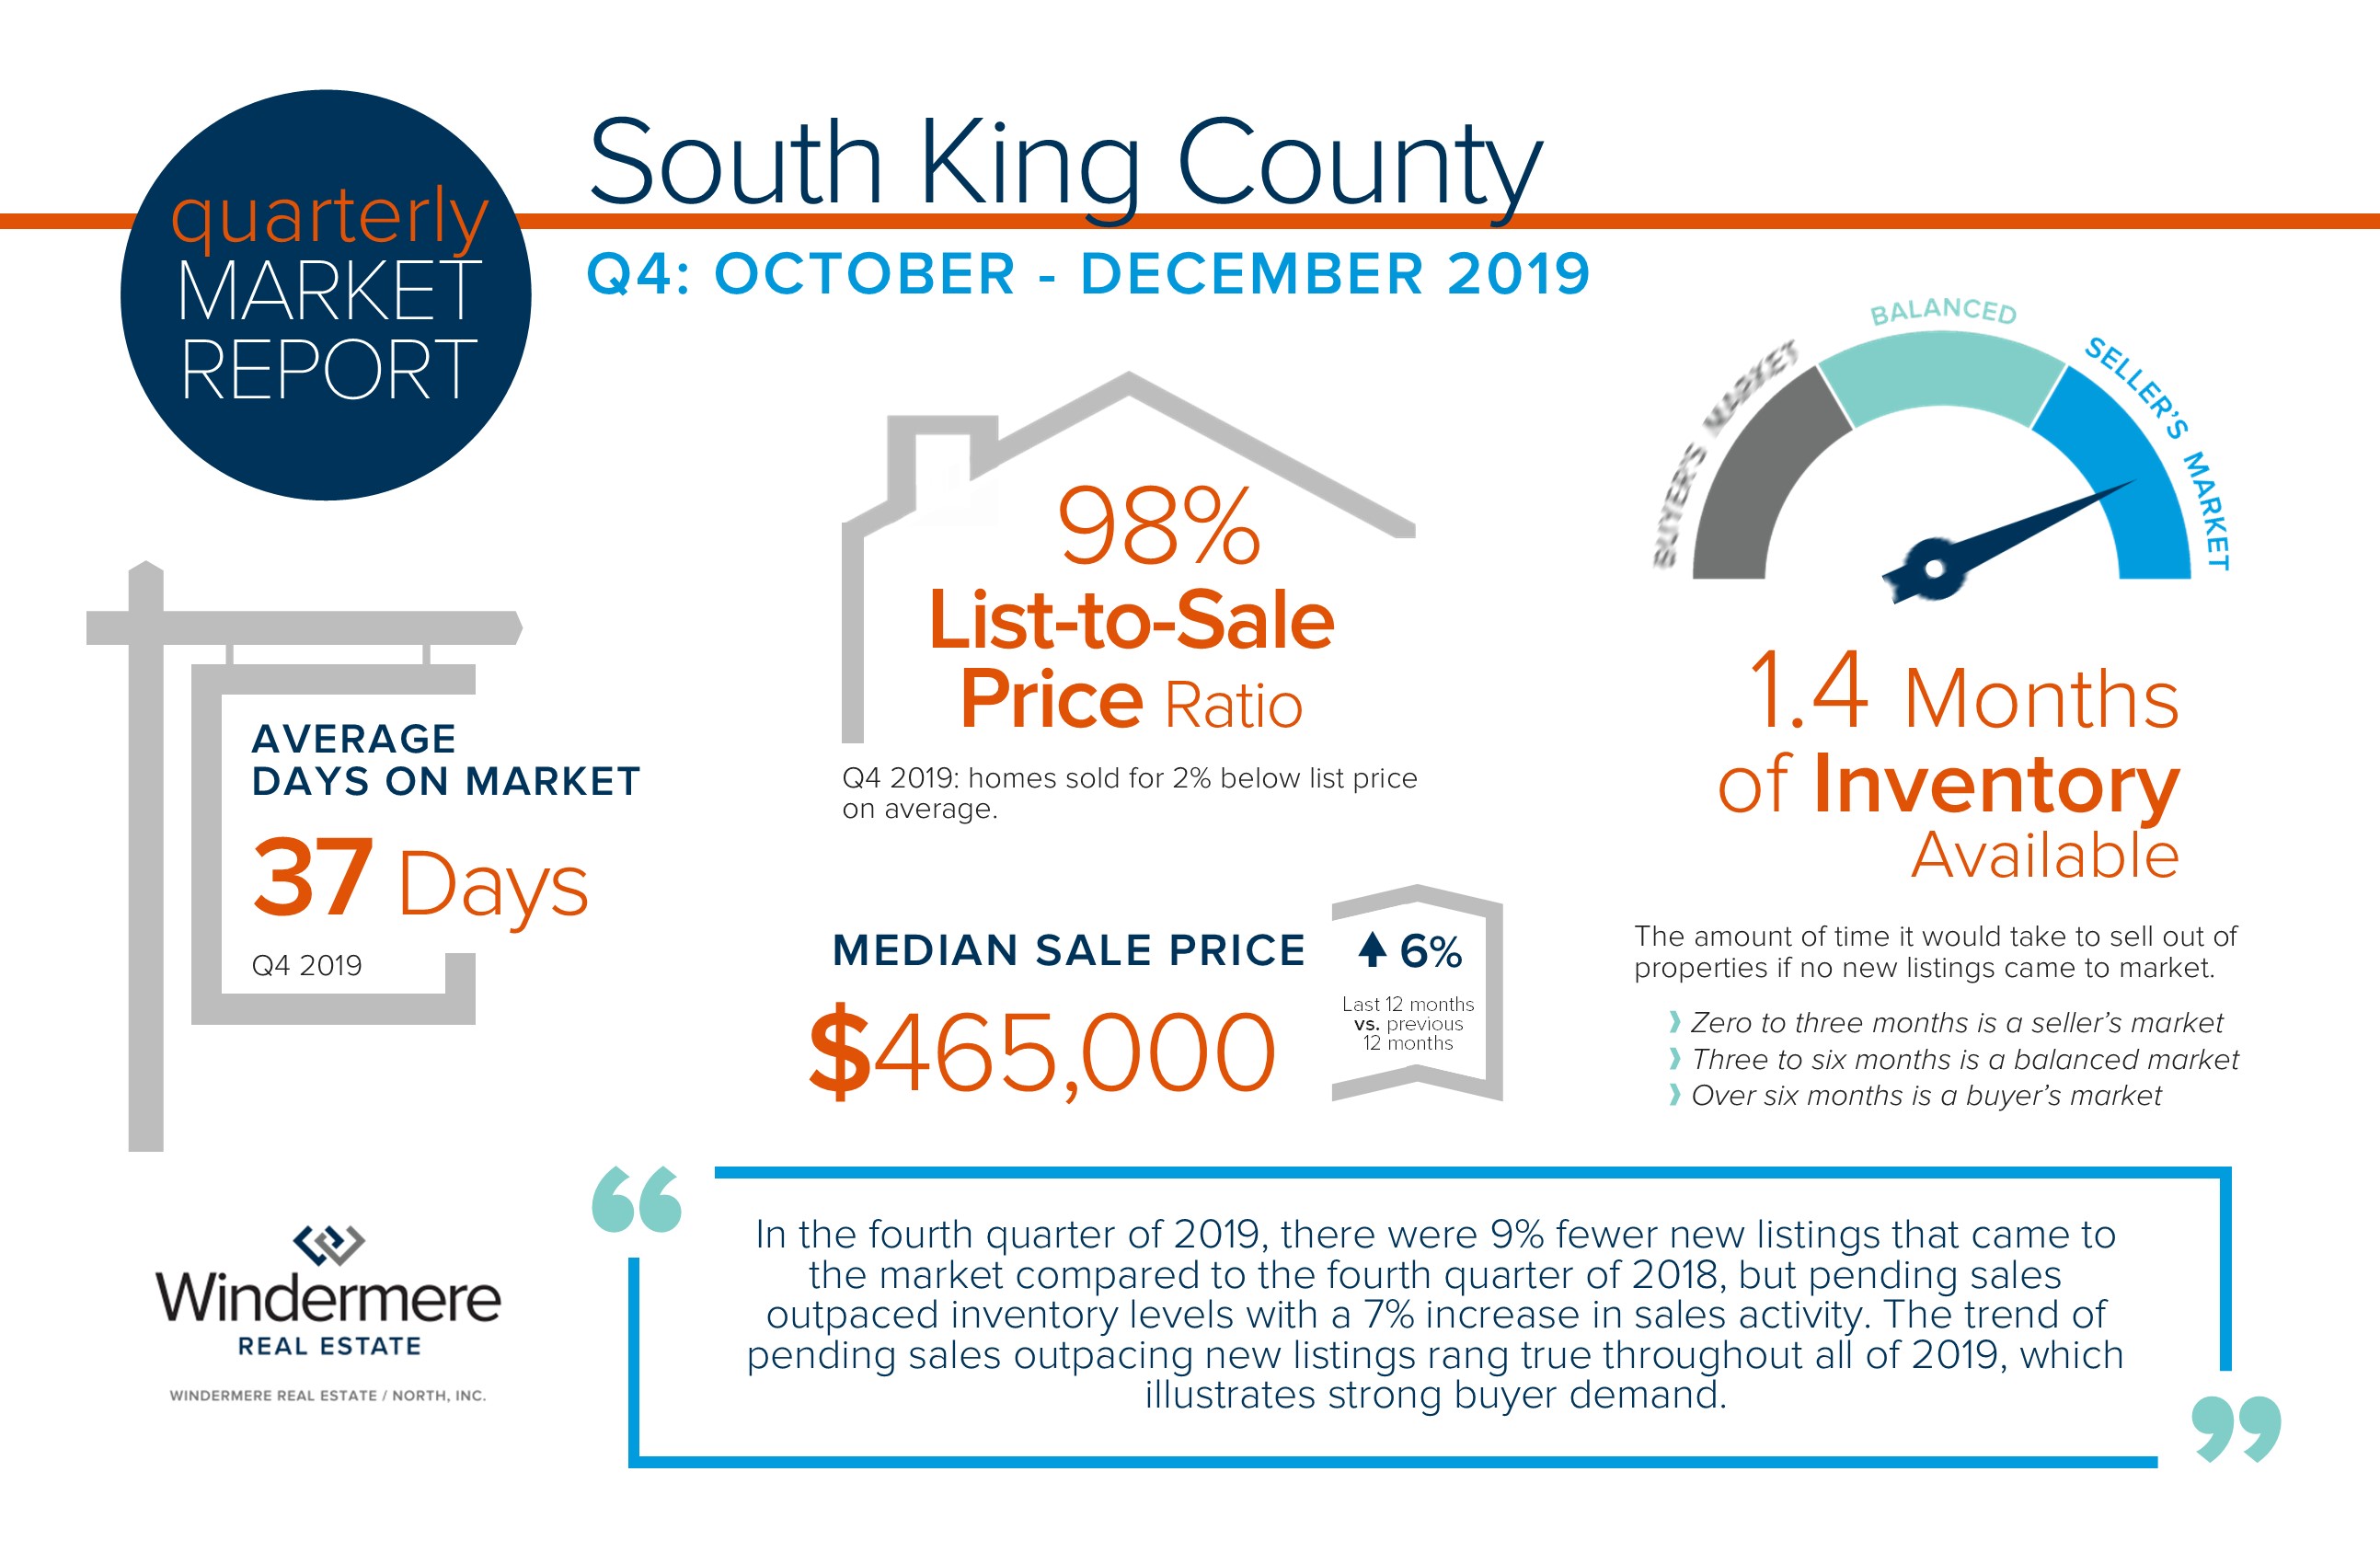
In the fourth quarter of 2019, there were 9% fewer new listings that came to the market compared to the fourth quarter of 2018, but pending sales outpaced inventory levels with a 7% increase in sales activity. The trend of pending sales outpacing new listings rang true throughout all of 2019, which illustrates strong buyer demand. This demand is being fueled by the lowest interest rates we have seen since 2016, additional job creation in our area, and the convergence of baby boomers making big lifestyle moves and millennials making their first home purchases. Equity levels are very healthy for many homeowners due to the last 8 years of price growth, providing the opportunity to make that right-size, move-up, or move-out-of-the-area move. An important factor to note as we head into Q1 of 2020 is the tighter-than-normal inventory levels. This will bode well for sellers, as buyers are anxious to secure a purchase with these historically low interest rates. Low interest rates are a benefit for buyers to have lower debt service, but also affords home sellers a larger audience.
This is only a snapshot of the trends in south King County; please contact me if you or someone you know would like further explanation of how the latest trends relate to your housing goals.
Eastside Quarterly Market Trends – Q4 2019
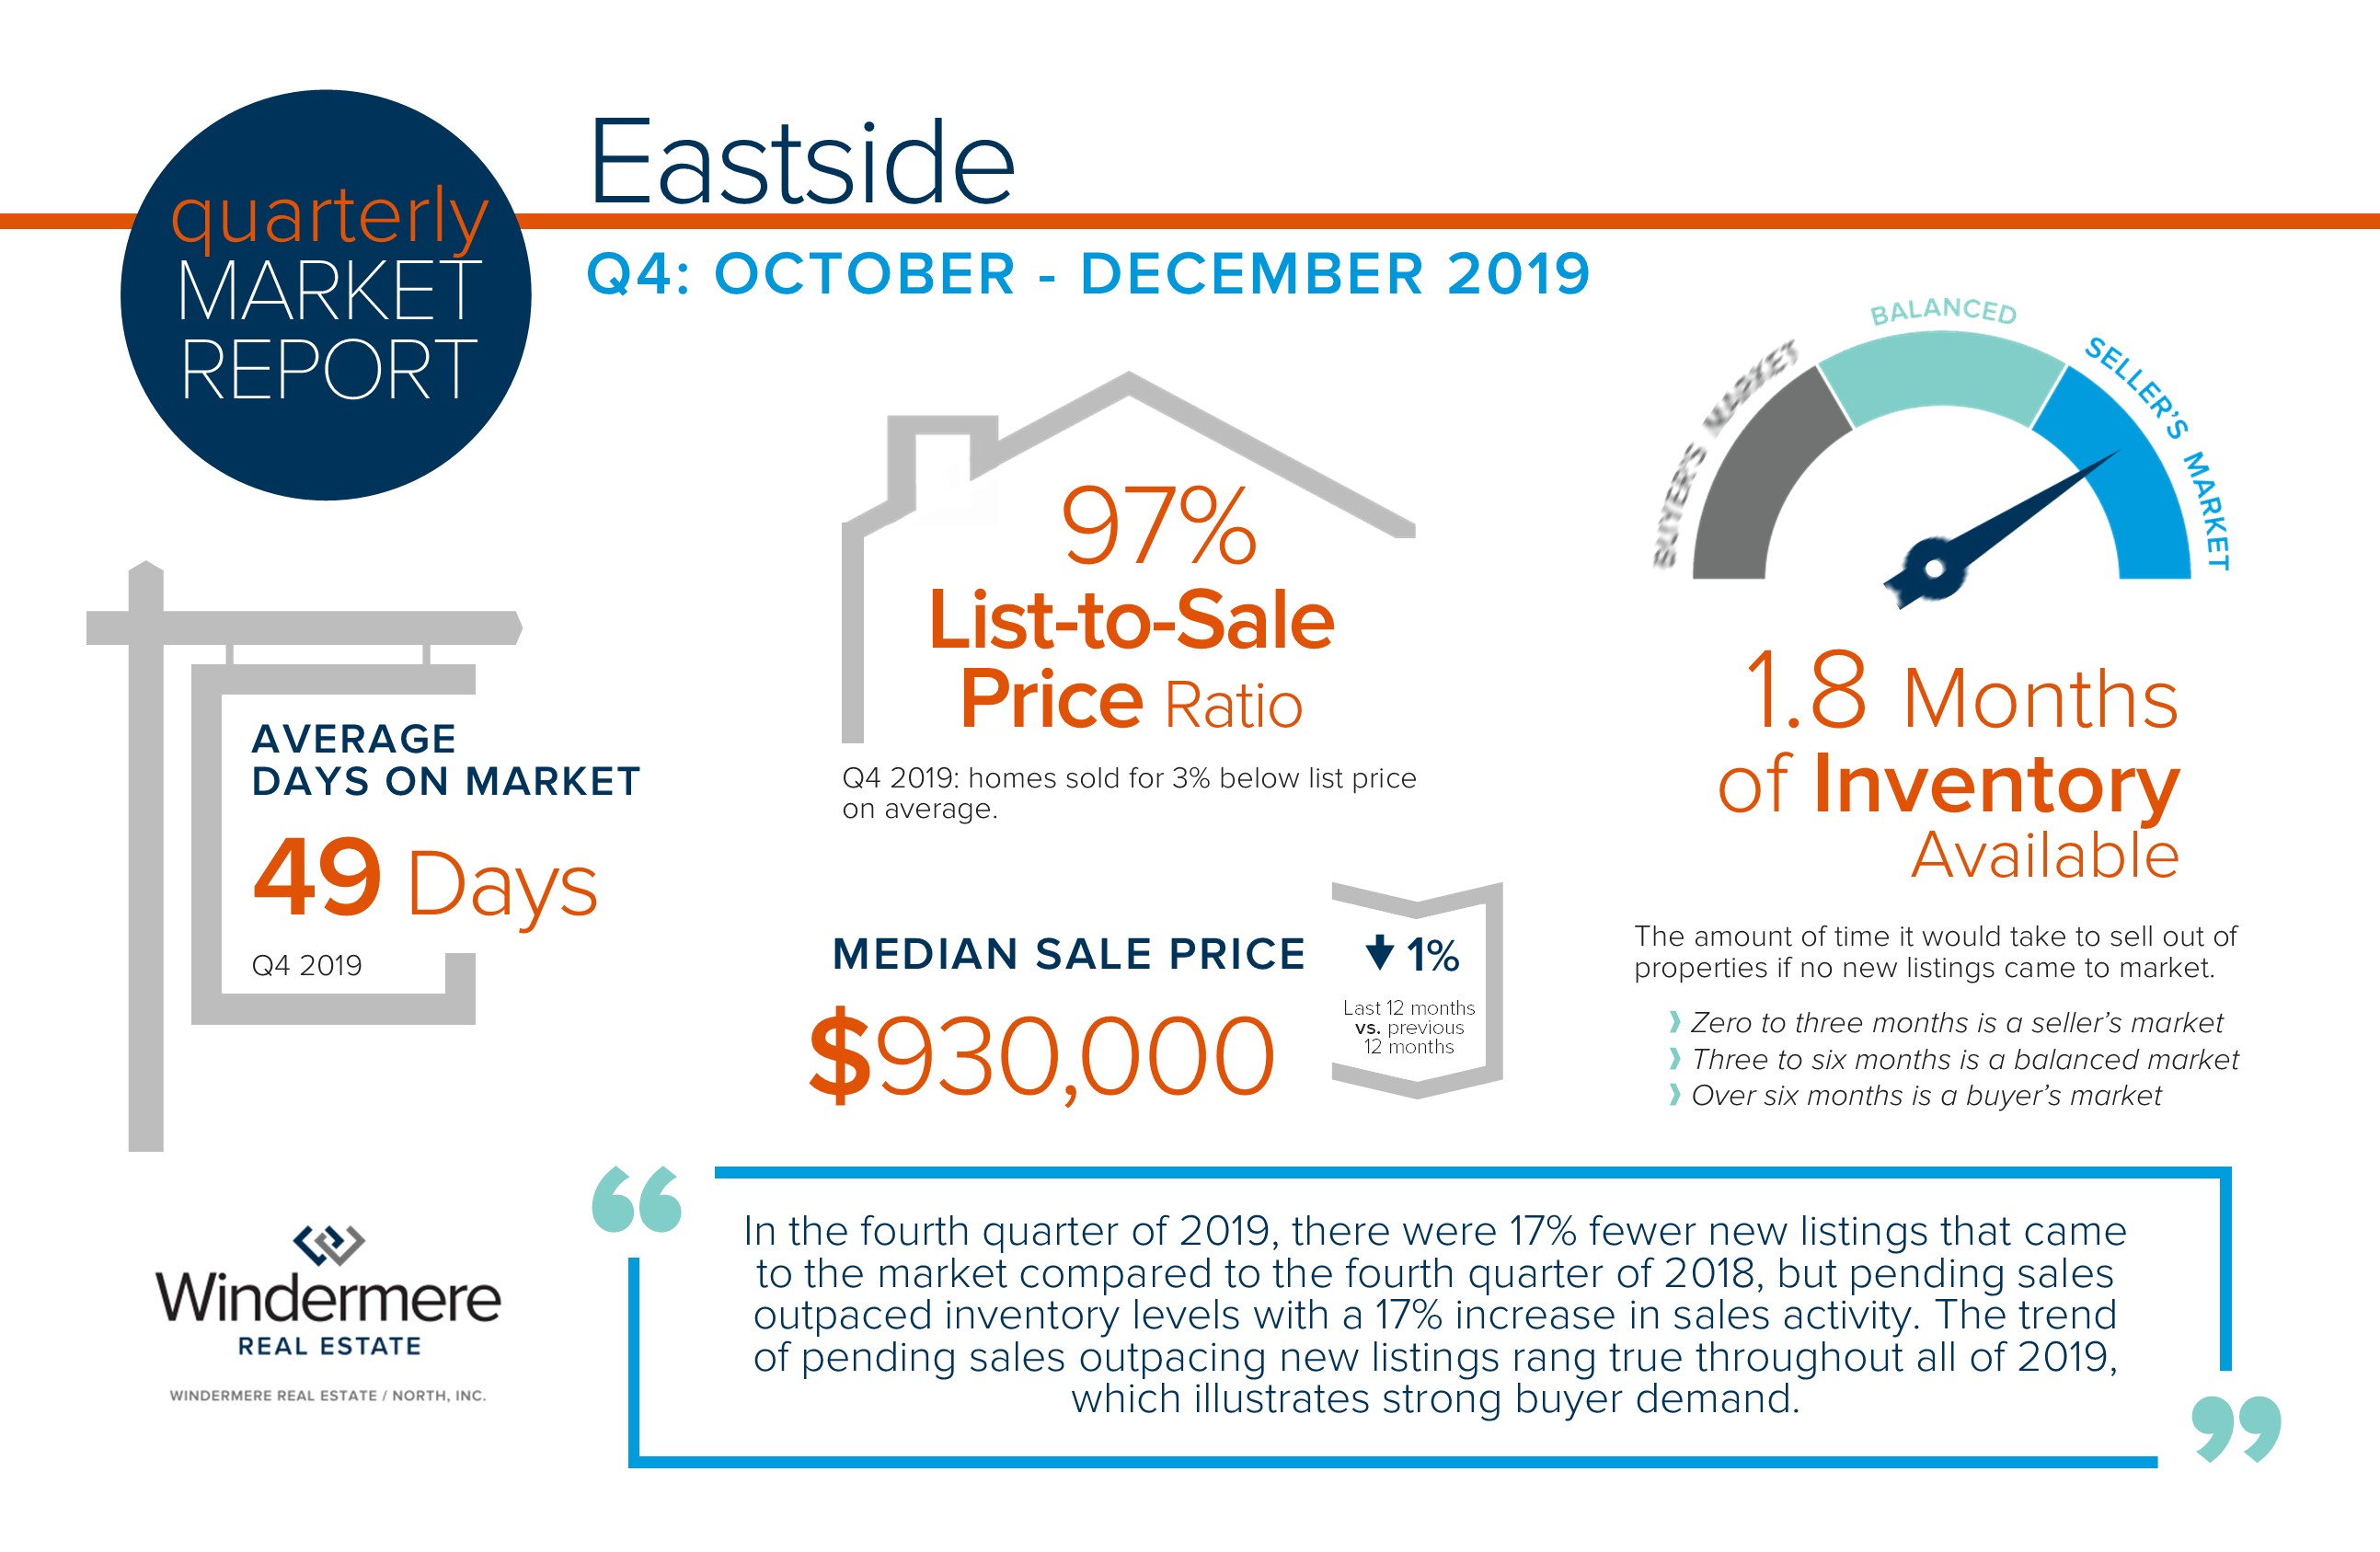
In the fourth quarter of 2019, there were 17% fewer new listings that came to the market compared to the fourth quarter of 2018, but pending sales outpaced inventory levels with a 17% increase in sales activity. The trend of pending sales outpacing new listings rang true throughout all of 2019, which illustrates strong buyer demand. This demand is being fueled by the lowest interest rates we have seen since 2016, additional job creation in our area, and the convergence of baby boomers making big lifestyle moves and millennials making their first home purchases. Equity levels are very healthy for many homeowners due to the last 8 years of price growth (despite the 2018-2019 correction), providing the opportunity to make that right-size, move-up, or move-out-of-the-area move. An important factor to note as we head into Q1 of 2020 is the tighter-than-normal inventory levels. This will bode well for sellers, as buyers are anxious to secure a purchase with these historically low interest rates. Low interest rates are a benefit for buyers to have lower debt service, but also affords home sellers a larger audience.
This is only a snapshot of the trends on the Eastside; please contact me if you or someone you know would like further explanation of how the latest trends relate to your housing goals.
Seattle Metro Quarterly Market Trends – Q4 2019
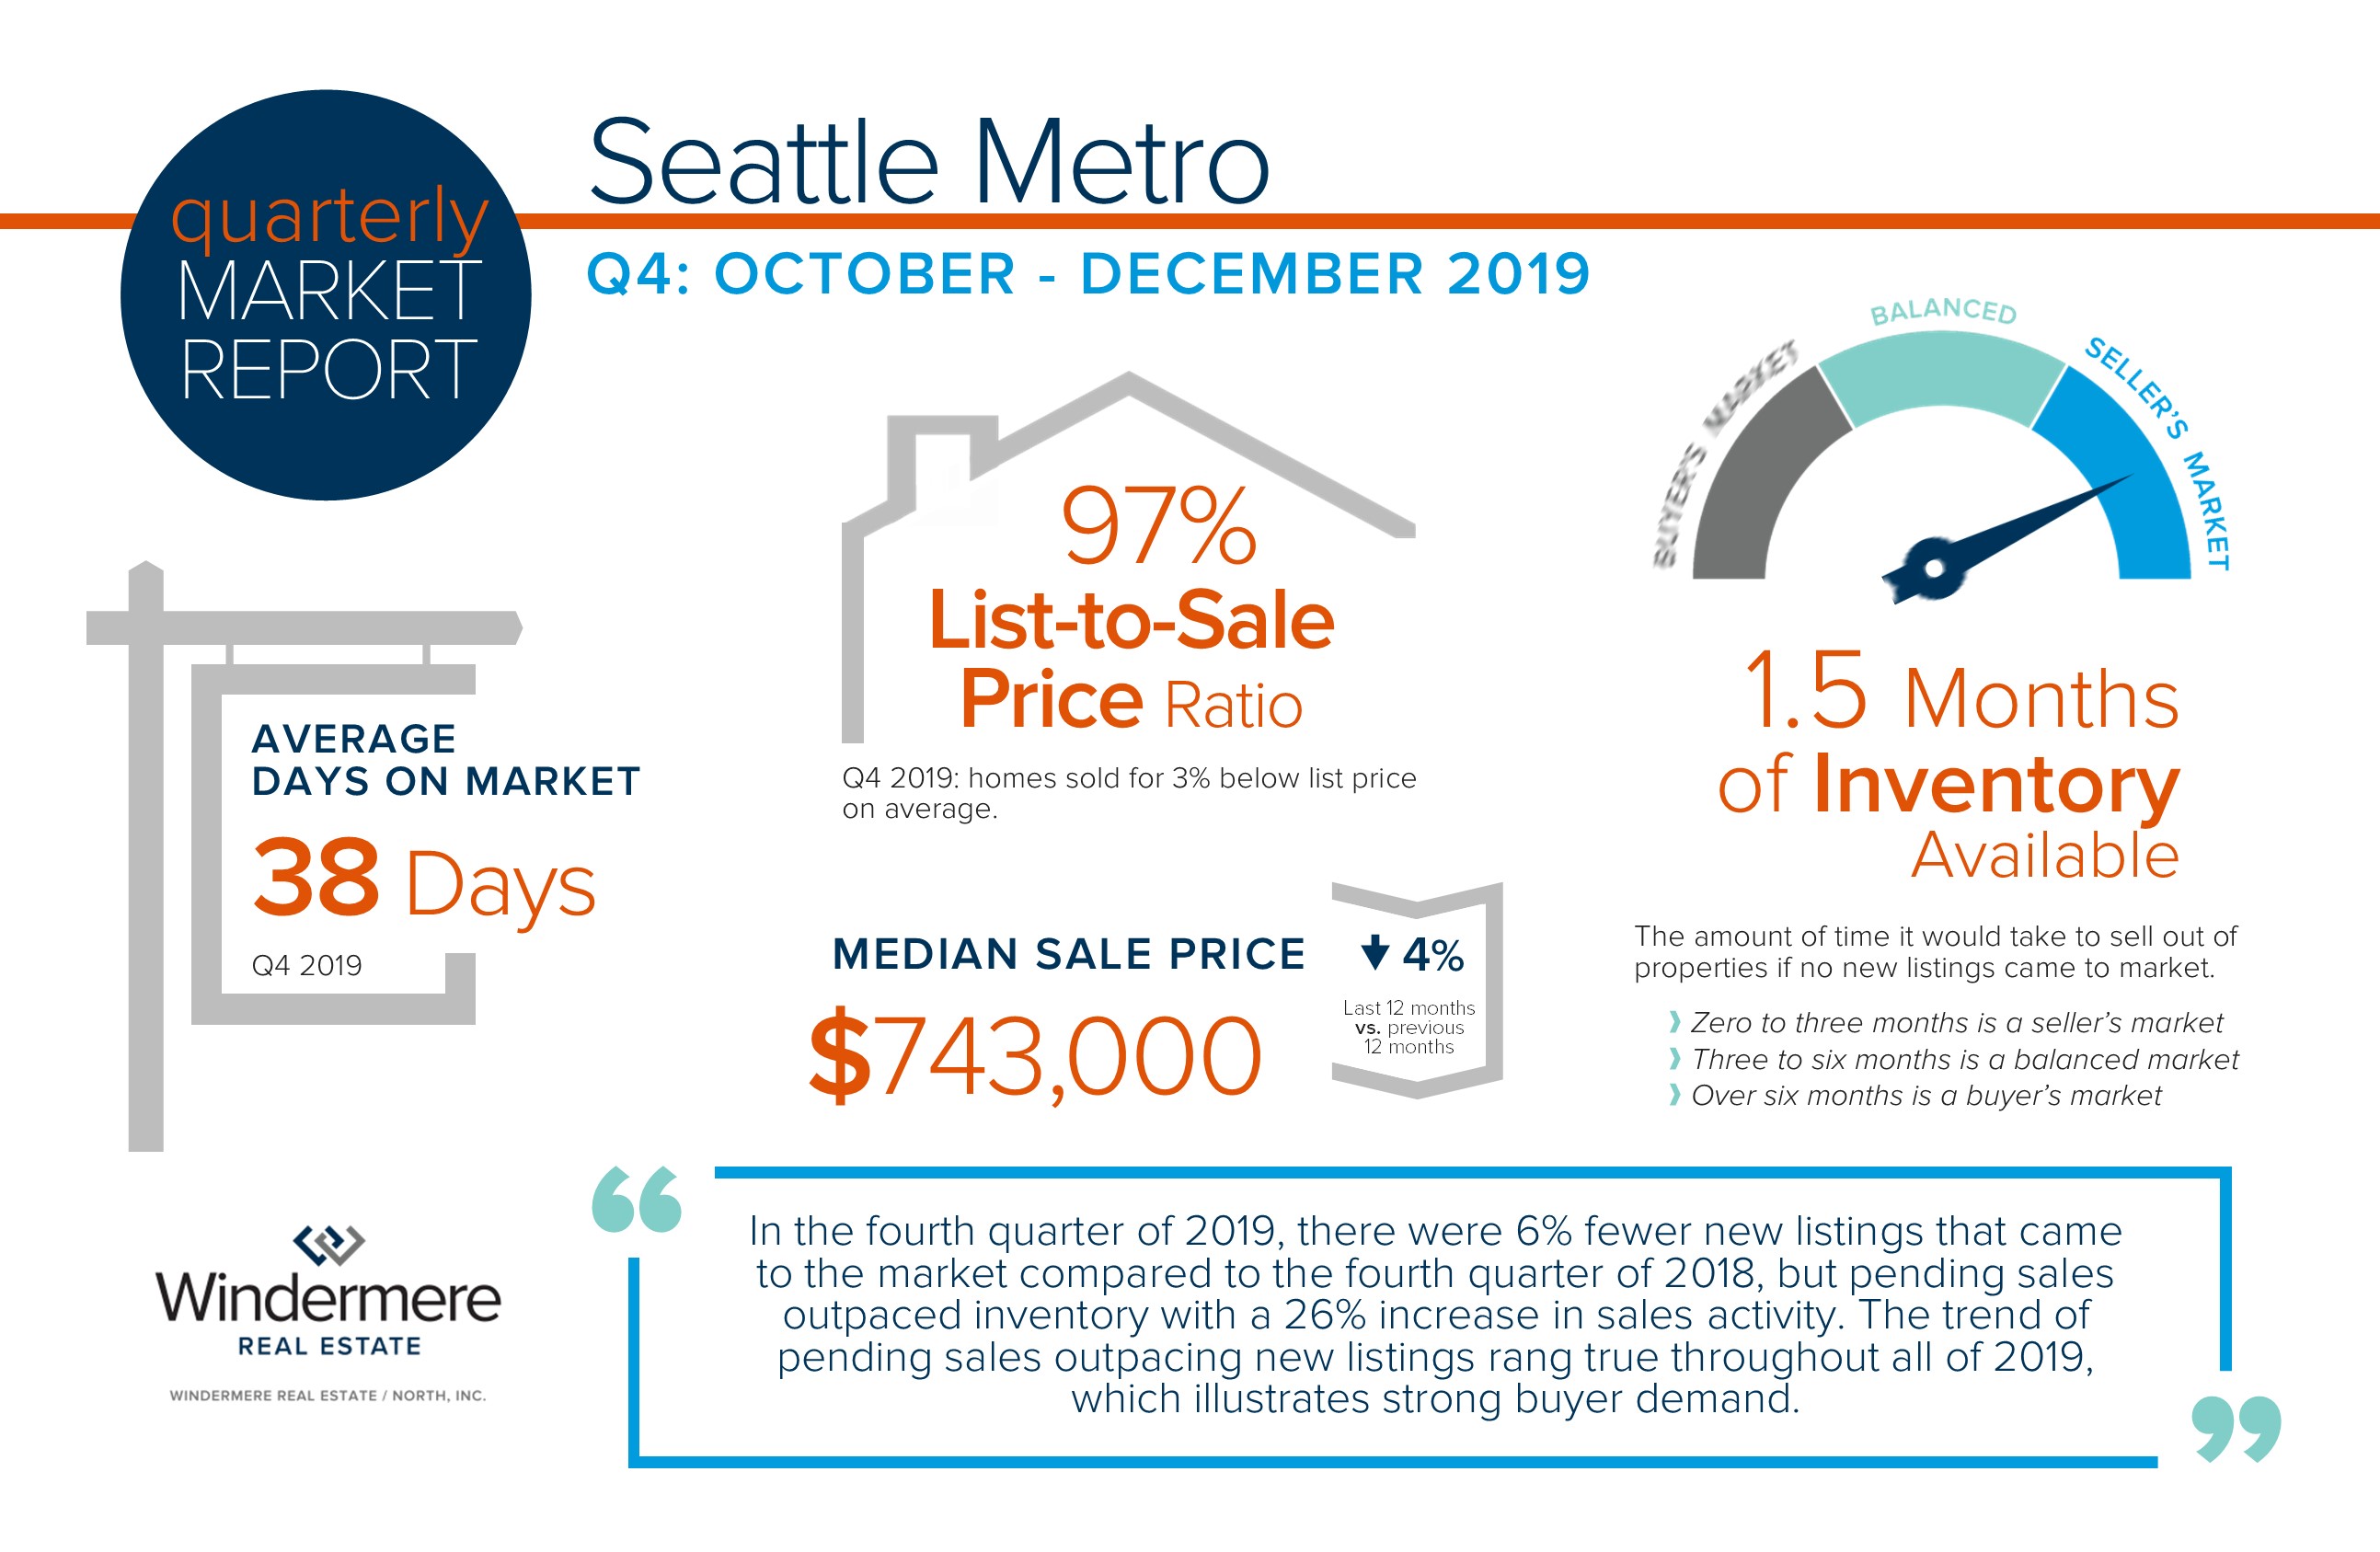
In the fourth quarter of 2019, there were 6% fewer new listings that came to the market compared to the fourth quarter of 2018, but pending sales outpaced inventory levels with a 26% increase in sales activity. The trend of pending sales outpacing new listings rang true throughout all of 2019, which illustrates strong buyer demand. This demand is being fueled by the lowest interest rates we have seen since 2016, additional job creation in our area, and the convergence of baby boomers making big lifestyle moves and millennials making their first home purchases. Equity levels are very healthy for many homeowners due to the last 8 years of price growth (despite the 2018-2019 correction), providing the opportunity to make that right-size, move-up, or move-out-of-the-area move. An important factor to note as we head into Q1 of 2020 is the tighter-than-normal inventory levels. This will bode well for sellers, as buyers are anxious to secure a purchase with these historically low interest rates. Low interest rates are a benefit for buyers to have lower debt service, but also affords home sellers a larger audience.
This is only a snapshot of the trends in the Seattle Metro area; please contact me if you or someone you know would like further explanation of how the latest trends relate to your housing goals.
North King County Quarterly Market Trends – Q4 2019
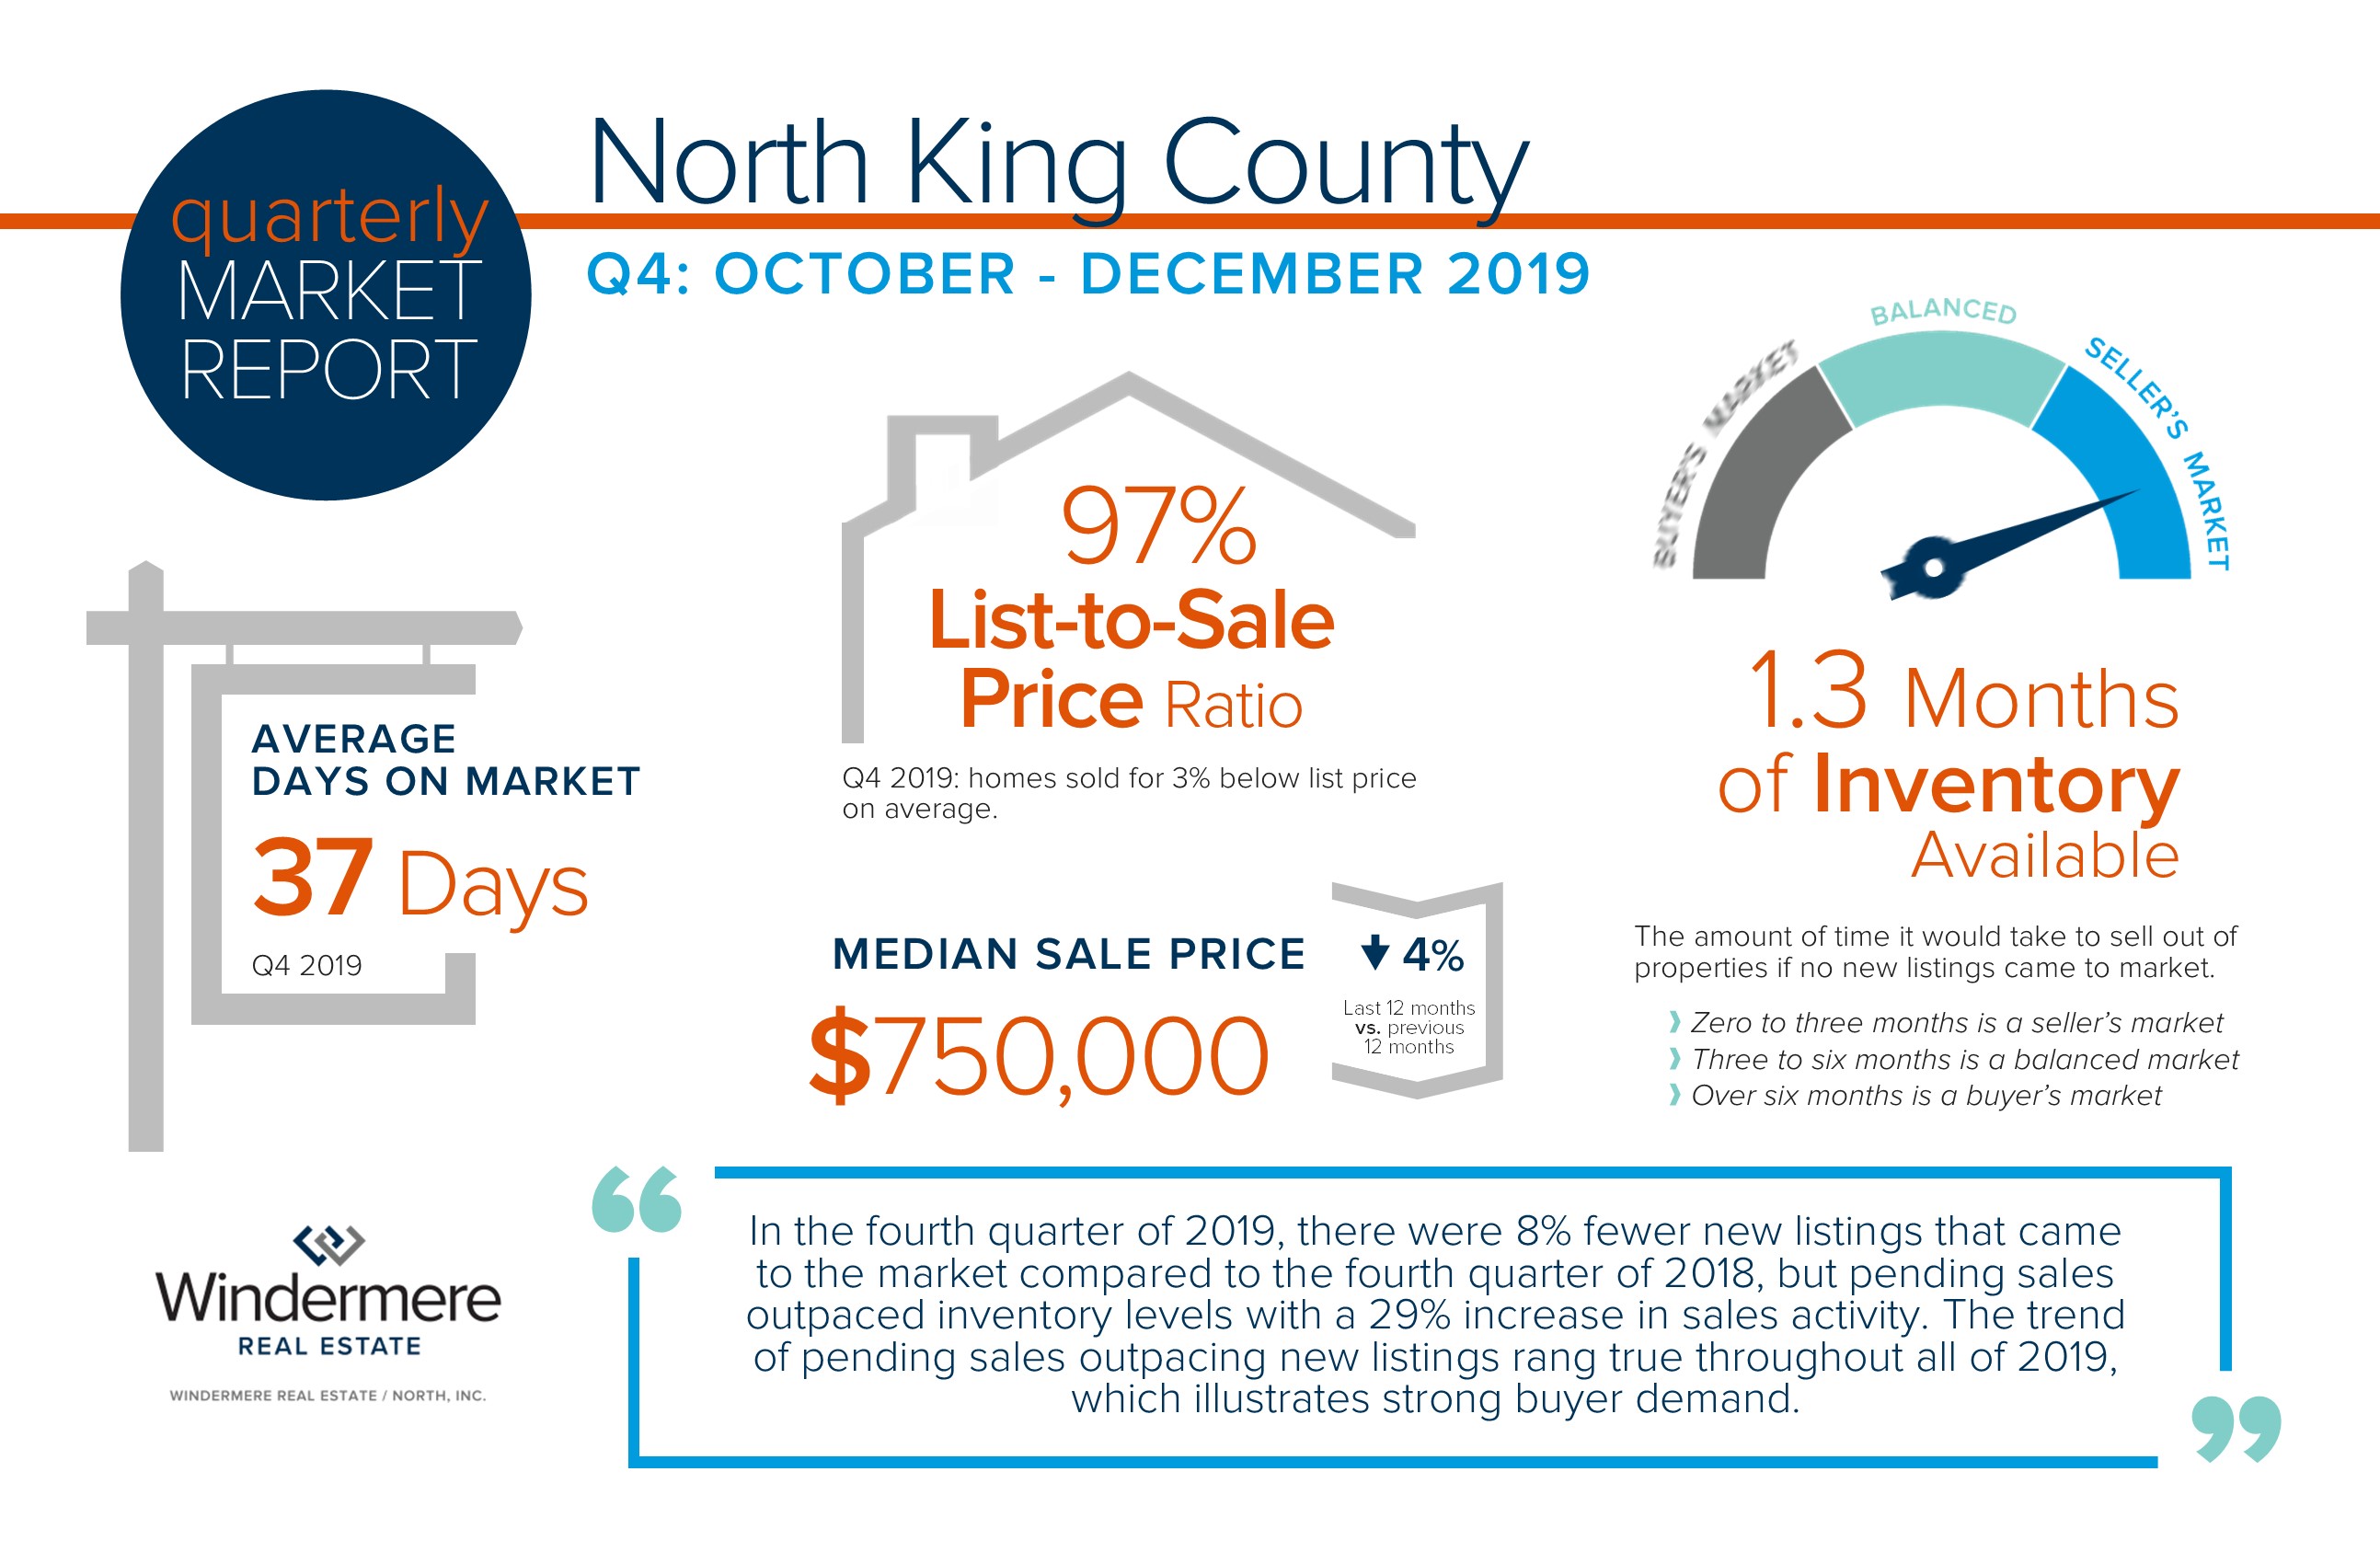
In the fourth quarter of 2019, there were 8% fewer new listings that came to the market compared to the fourth quarter of 2018, but pending sales outpaced inventory levels with a 29% increase in sales activity. The trend of pending sales outpacing new listings rang true throughout all of 2019, which illustrates strong buyer demand. This demand is being fueled by the lowest interest rates we have seen since 2016, additional job creation in our area, and the convergence of baby boomers making big lifestyle moves and millennials making their first home purchases. Equity levels are very healthy for many homeowners due to the last 8 years of price growth (despite the 2018-2019 correction), providing the opportunity to make that right-size, move-up, or move-out-of-the-area move. An important factor to note as we head into Q1 of 2020 is the tighter-than-normal inventory levels. This will bode well for sellers, as buyers are anxious to secure a purchase with these historically low interest rates. Low interest rates are a benefit for buyers to have lower debt service, but also affords home sellers a larger audience.
This is only a snapshot of the trends in north King County; please contact me if you or someone you know would like further explanation of how the latest trends relate to your housing goals.
South Snohomish County Quarterly Market Trends – Q4 2019
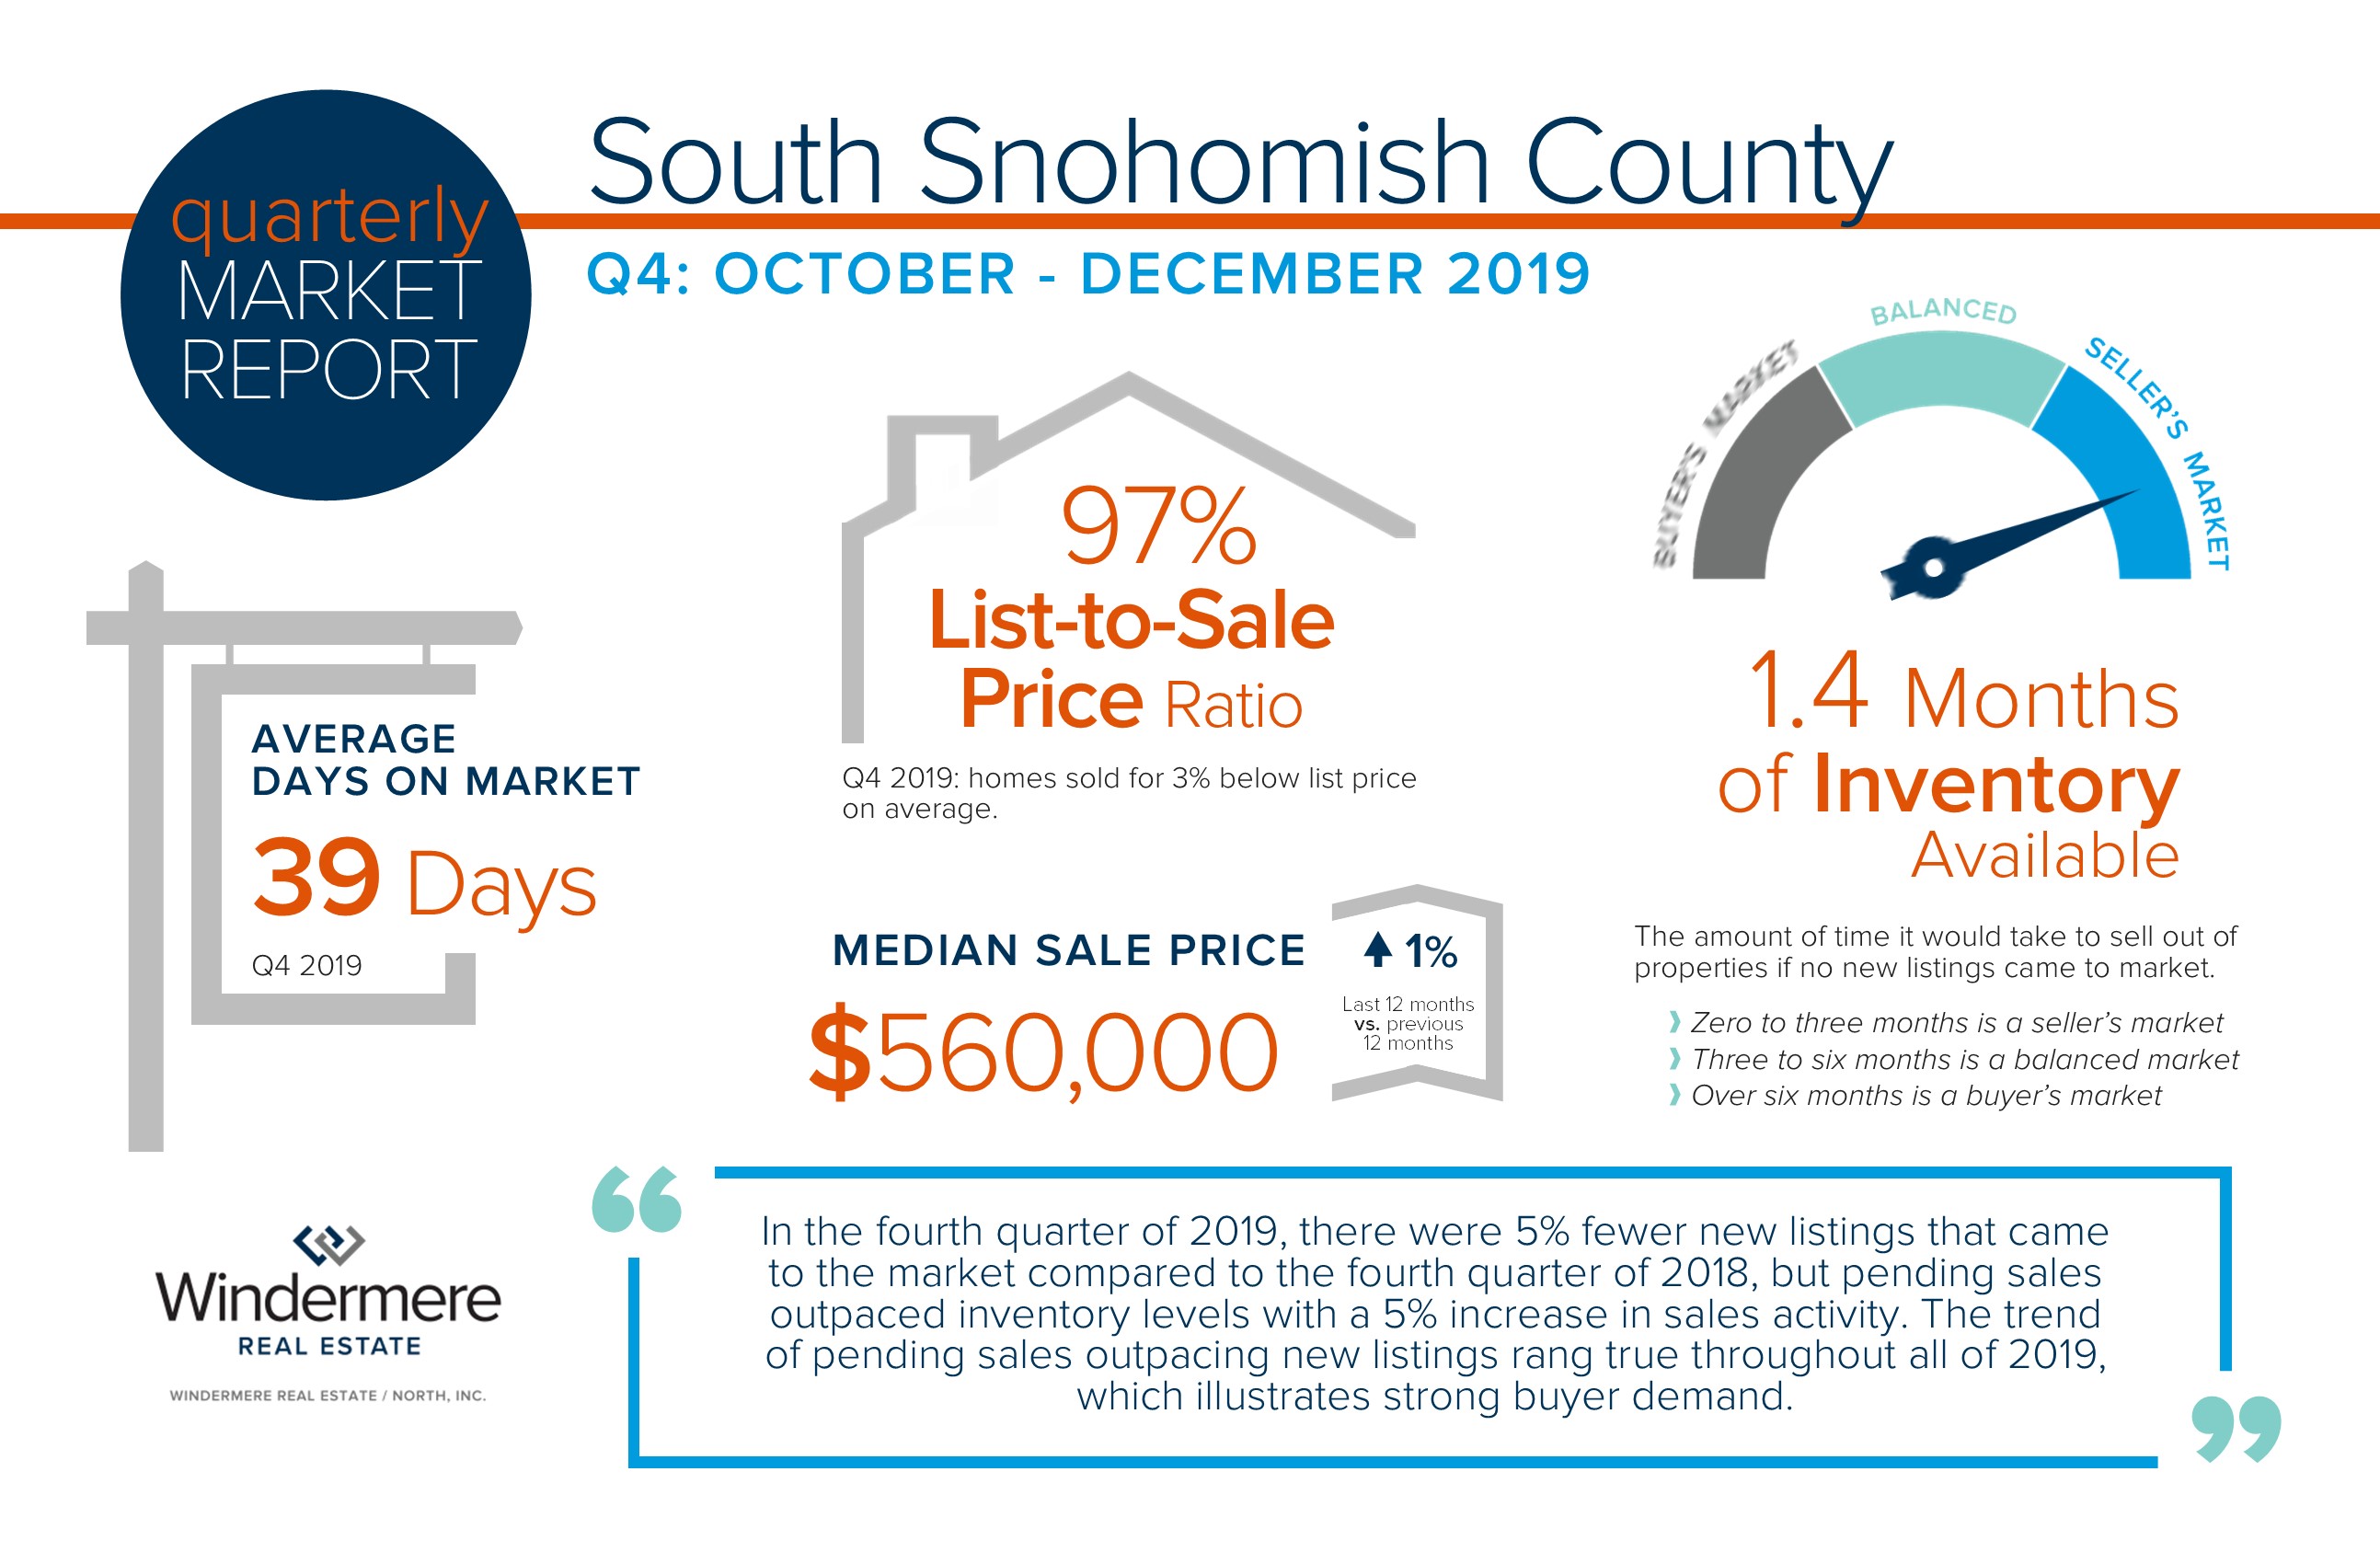
In the fourth quarter of 2019, there were 5% fewer new listings that came to the market compared to the fourth quarter of 2018, but pending sales outpaced inventory levels with a 5% increase in sales activity. The trend of pending sales outpacing new listings rang true throughout all of 2019, which illustrates strong buyer demand. This demand is being fueled by the lowest interest rates we have seen since 2016, additional job creation in our area, and the convergence of baby boomers making big lifestyle moves and millennials making their first home purchases. Equity levels are very healthy for many homeowners due to the last 8 years of price growth providing the opportunity to make that right-size, move-up, or move-out-of-the-area move. An important factor to note as we head into Q1 of 2020 is the tighter-than-normal inventory levels. This will bode well for sellers, as buyers are anxious to secure a purchase with these historically low interest rates. Low interest rates are a benefit for buyers to have lower debt service, but also affords home sellers a larger audience.
This is only a snapshot of the trends in south Snohomish County; please contact me if you or someone you know would like further explanation of how the latest trends relate to your housing goals.
North Snohomish County Quarterly Market Trends – Q4 2019
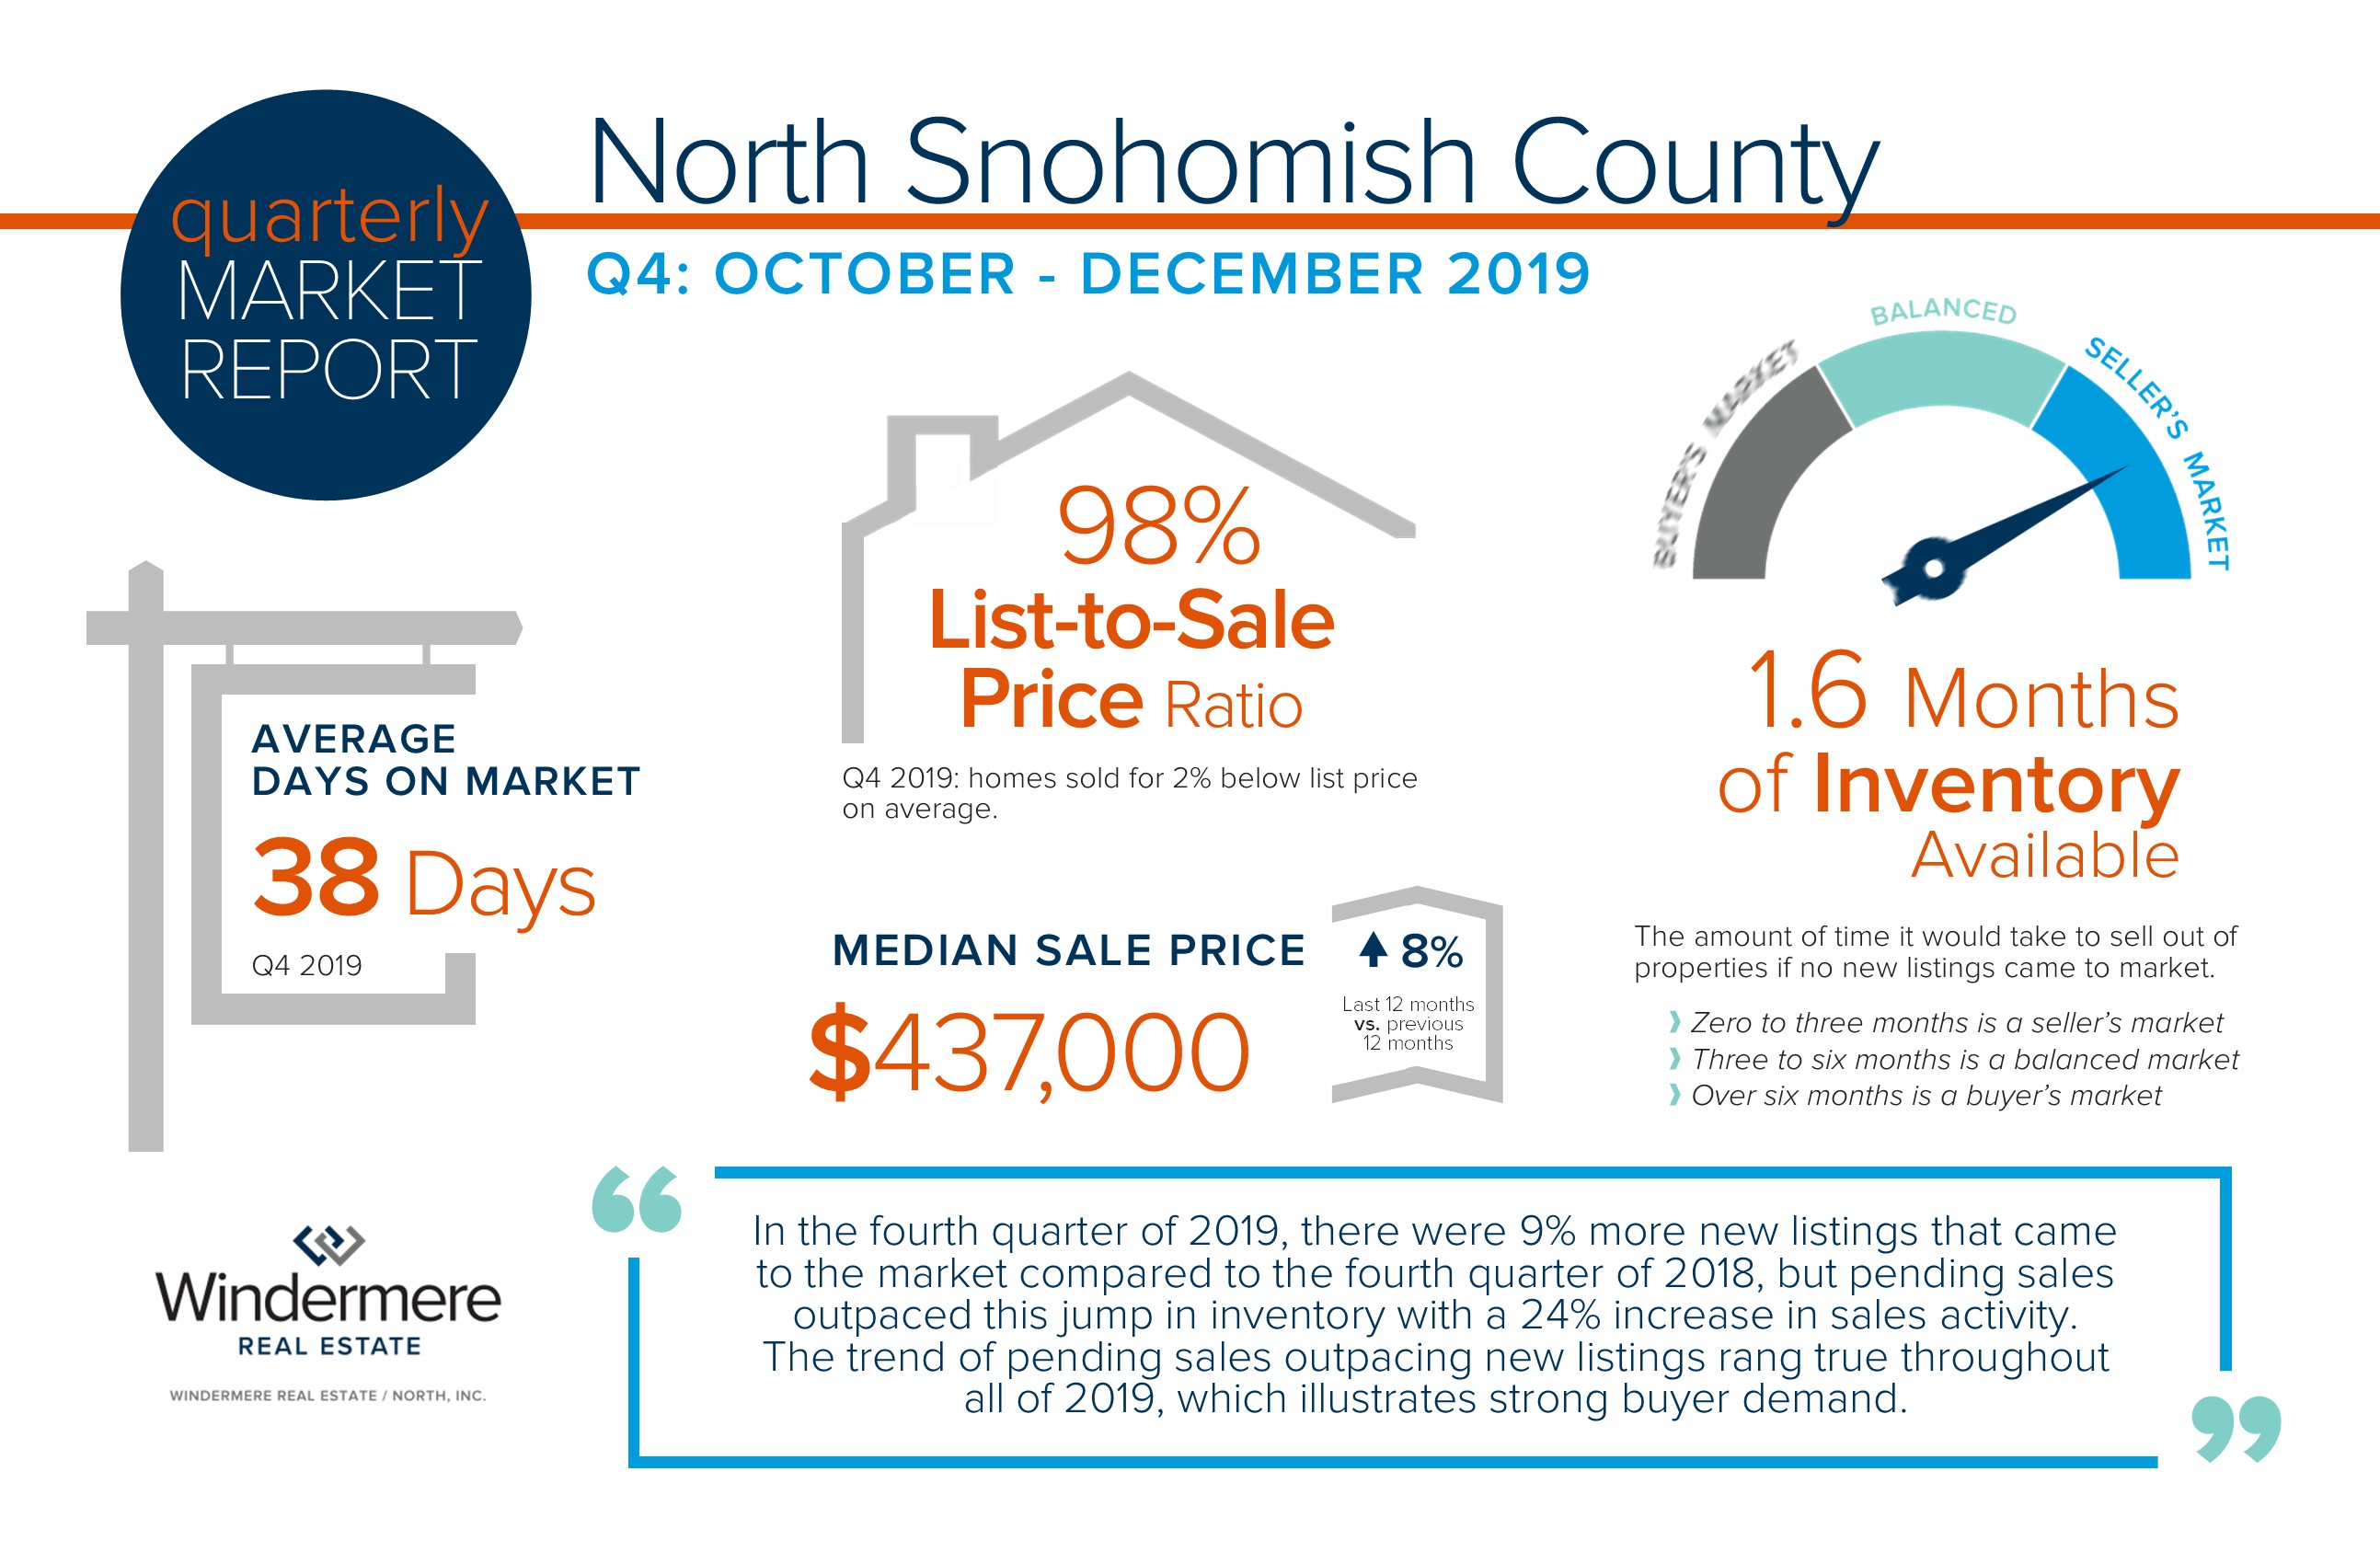
In the fourth quarter of 2019, there were 9% more new listings that came to the market compared to the fourth quarter of 2018, but pending sales outpaced this jump in inventory with a 24% increase in sales activity. The trend of pending sales outpacing new listings rang true throughout all of 2019 which illustrates strong buyer demand. This demand is being fueled by the lowest interest rates we have seen since 2016, additional job creation in our area, and the convergence of baby boomers making big lifestyle moves and millennials making their first home purchases. Equity levels are very healthy for many homeowners due to the last 8 years of price growth, providing the opportunity to make that right-size, move-up, or move-out-of-the-area move. An important factor to note as we head into Q1 of 2020 is the tighter-than-normal inventory levels. This will bode well for sellers, as buyers are anxious to secure a purchase with these historically low interest rates. Low interest rates are a benefit for buyers to have lower debt service, but also affords home sellers a larger audience.
This is only a snapshot of the trends in north Snohomish County; please contact me if you or someone you know would like further explanation of how the latest trends relate to your housing goals.
Monthly Newsletter – January 2020: Top 12 Takeaways from Matthew Gardner for 2020, A Macro-to-Micro Look at the Economy & Housing Market

 Last week, I had the pleasure of attending our office’s 11th Annual Matthew Gardner Economic Forecast Event. At this event, Matthew gives the crowd a review of the previous year and forecasts trends for the economy and housing market for the next year and beyond. Below are my Top 12 Takeaways worth noting as you start to chart your economic goals for 2020 and beyond.
- He anticipates our next recession taking place in 2021, not 2020 as previously thought. The last 11 recessions averaged 58 months in between one recession to the next, and we are currently at 127 months since the last recession, so we are due. Worth noting is the next recession will not be based on housing like the previous recession. It is predicted to be a more normal adjustment that should also be short in length, unlike the Great Recession of 2008-2010.
- Recessions do not always cause home prices to drop. Of the last six recessions, home prices actually ended up higher than when the recession began with the exception of the Great Recession of 2008-2010, which was based on housing due to predatory lending.
- The U.S. Economy will add 1.8M new jobs, but national unemployment rates should rise to 4% from 3.5% by the end of 2020. However, wage growth should start to improve as that has been slow over the last decade. In the Greater Seattle area, unemployment hovered at 3% in Q3 of 2019.
- We are living in our homes longer. In 2019, the average home seller in the U.S had owned their home for an average of 8.2 years compared to the average home seller in 2000 at 4.2 years. This is reflective of homeowners choosing to build more equity over time before they cash-out and move on to the next home, as well as the increased amount of Baby Boomers coming to market with their long-time homes as they pivot towards retirement.
- We are not headed toward a housing bubble. When seasonally adjusted, home prices are still 5.8% below the prior peak. In addition, predatory lending practices were eliminated after the 2008 housing crash and the average down payment is much higher. Overall, home equity is high with the national average in Q3 2019 sitting at 26.7% and the average FICO score of a borrower in Q3 of 2019 was 755. This, along with foreclosure starts being low, indicates that we are not headed towards a housing bubble.
- Interest rates should remain under 4% in 2020. These are historical lows, but reflective of the last decade. In 2010, rates were around 5% and were as low as 3.4% in 2012. In late 2018, rates almost crested 5% but careened down under 4% for most of the year. The 2000’s averaged 6.3%, the 1990’s 8.1%, the 1980’s 12.7%, and the 1970’s 8.9%. This should put today’s rates in perspective.
- Single-family new construction remains muted due to the expensive cost of land, labor, materials, and regulatory fees. This has made inventory levels tighter and the appreciation of existing homes stronger. The lack of overbuilding is also another contributing factor to no housing bubble.
- Millennials are a force in the real estate market! They are the largest generation at 79M, are the largest cohort in the U.S. workforce, and more than 1M Millennial women are becoming moms every year. This generation has grown up and is experiencing big life transitions that lead to home ownership decisions. Nationally, they accounted for 37.5% of home purchases in Q3 of 2019. In the Greater Seattle area in 2019, 46% of home purchases were done by Millennials with an average down payment of 17% and with a FICO score of 741.
- The Greater Seattle economy looks to outperform the U.S. economy due to continued corporate growth, specifically in information services, which will balance out any losses we may see due to the current setbacks in aerospace.
- In the Greater Seattle area, as we start 2020 inventory levels are tight due to a high level of absorption over the course of 2019 after a big inventory dump in mid-2018. Many investors offloaded properties in 2018 and it took time to absorb this inventory as it accompanied a time frame where interest rates were near 5%. The market softened at that time, but now we have returned to constricted inventory levels and lower interest rates. This will bode well for home sellers and provide buyers low debt service.
- The average sale price in King County in December of 2019 was $830,000 and King County saw a 3% increase in home prices in all of 2019 over all of 2018. It is predicted, due to low inventory, strong job growth. and low interest rates that year-over-year price appreciation in King County in 2020 will be around 6.6%. Affordability and consumer sentiment are the biggest challenges in King County, especially in-city Seattle and on the Eastside, which are closer to job centers.
- The average sale price in Snohomish County in December of 2019 was $552,000 and Snohomish County saw a 5% increase in home prices in 2019 over 2018. It is predicted, due to low inventory, strong job growth, and low interest rates that year-over-year price appreciation in Snohomish County in 2020 will be around 7.3%. Snohomish County has benefited from the high prices in King County, leading folks to purchase further out for affordability purposes.
If you would like more information or a copy of Matthew’s PowerPoint, please reach out. It is my goal to help keep my clients well-informed in order to empower strong decisions. 2020 looks to be another positive year in real estate! If you or anyone you know is considering either buying or selling, please use me as a resource. It is an honor to help people make such important investments and meaningful lifestyle choices.
As Chief Economist for Windermere Real Estate, Matthew Gardner is responsible for analyzing and interpreting economic data and its impact on the real estate market on both a local and national level. Matthew has over 30 years of professional experience both in the U.S. and U.K.
In addition to his day-to-day responsibilities, Matthew sits on the Washington State Governors Council of Economic Advisors; chairs the Board of Trustees at the Washington Center for Real Estate Research at the University of Washington; and is an Advisory Board Member at the Runstad Center for Real Estate Studies at the University of Washington where he also lectures in real estate economics.
 I am pleased to present the fourth-quarter 2019 edition of the Gardner Report, which provides insights into select counties of the Western Washington housing market. This analysis is provided by Windermere Real Estate Chief Economist Matthew Gardner. I hope that this information will assist you with making better-informed real estate decisions. For further information about the housing market in your area, please don’t hesitate to contact me.
 In 2019 Windermere agents, offices, and staff raised nearly $3 million for the Windermere Foundation, surpassing $40 million total raised since 1989. These dollars stay local, supporting low-income and homeless families in the communities where we do business. We’re proud of the work we’ve done so far, but there’s so much left to do. As we begin 2020, we look forward to seeing how we can further impact each community we serve.
 Facebook
 X
X
 Pinterest
 Copy Link


