
 Facebook
 X
X
 Pinterest
 Copy Link
Seattle Metro Quarterly Market Trends
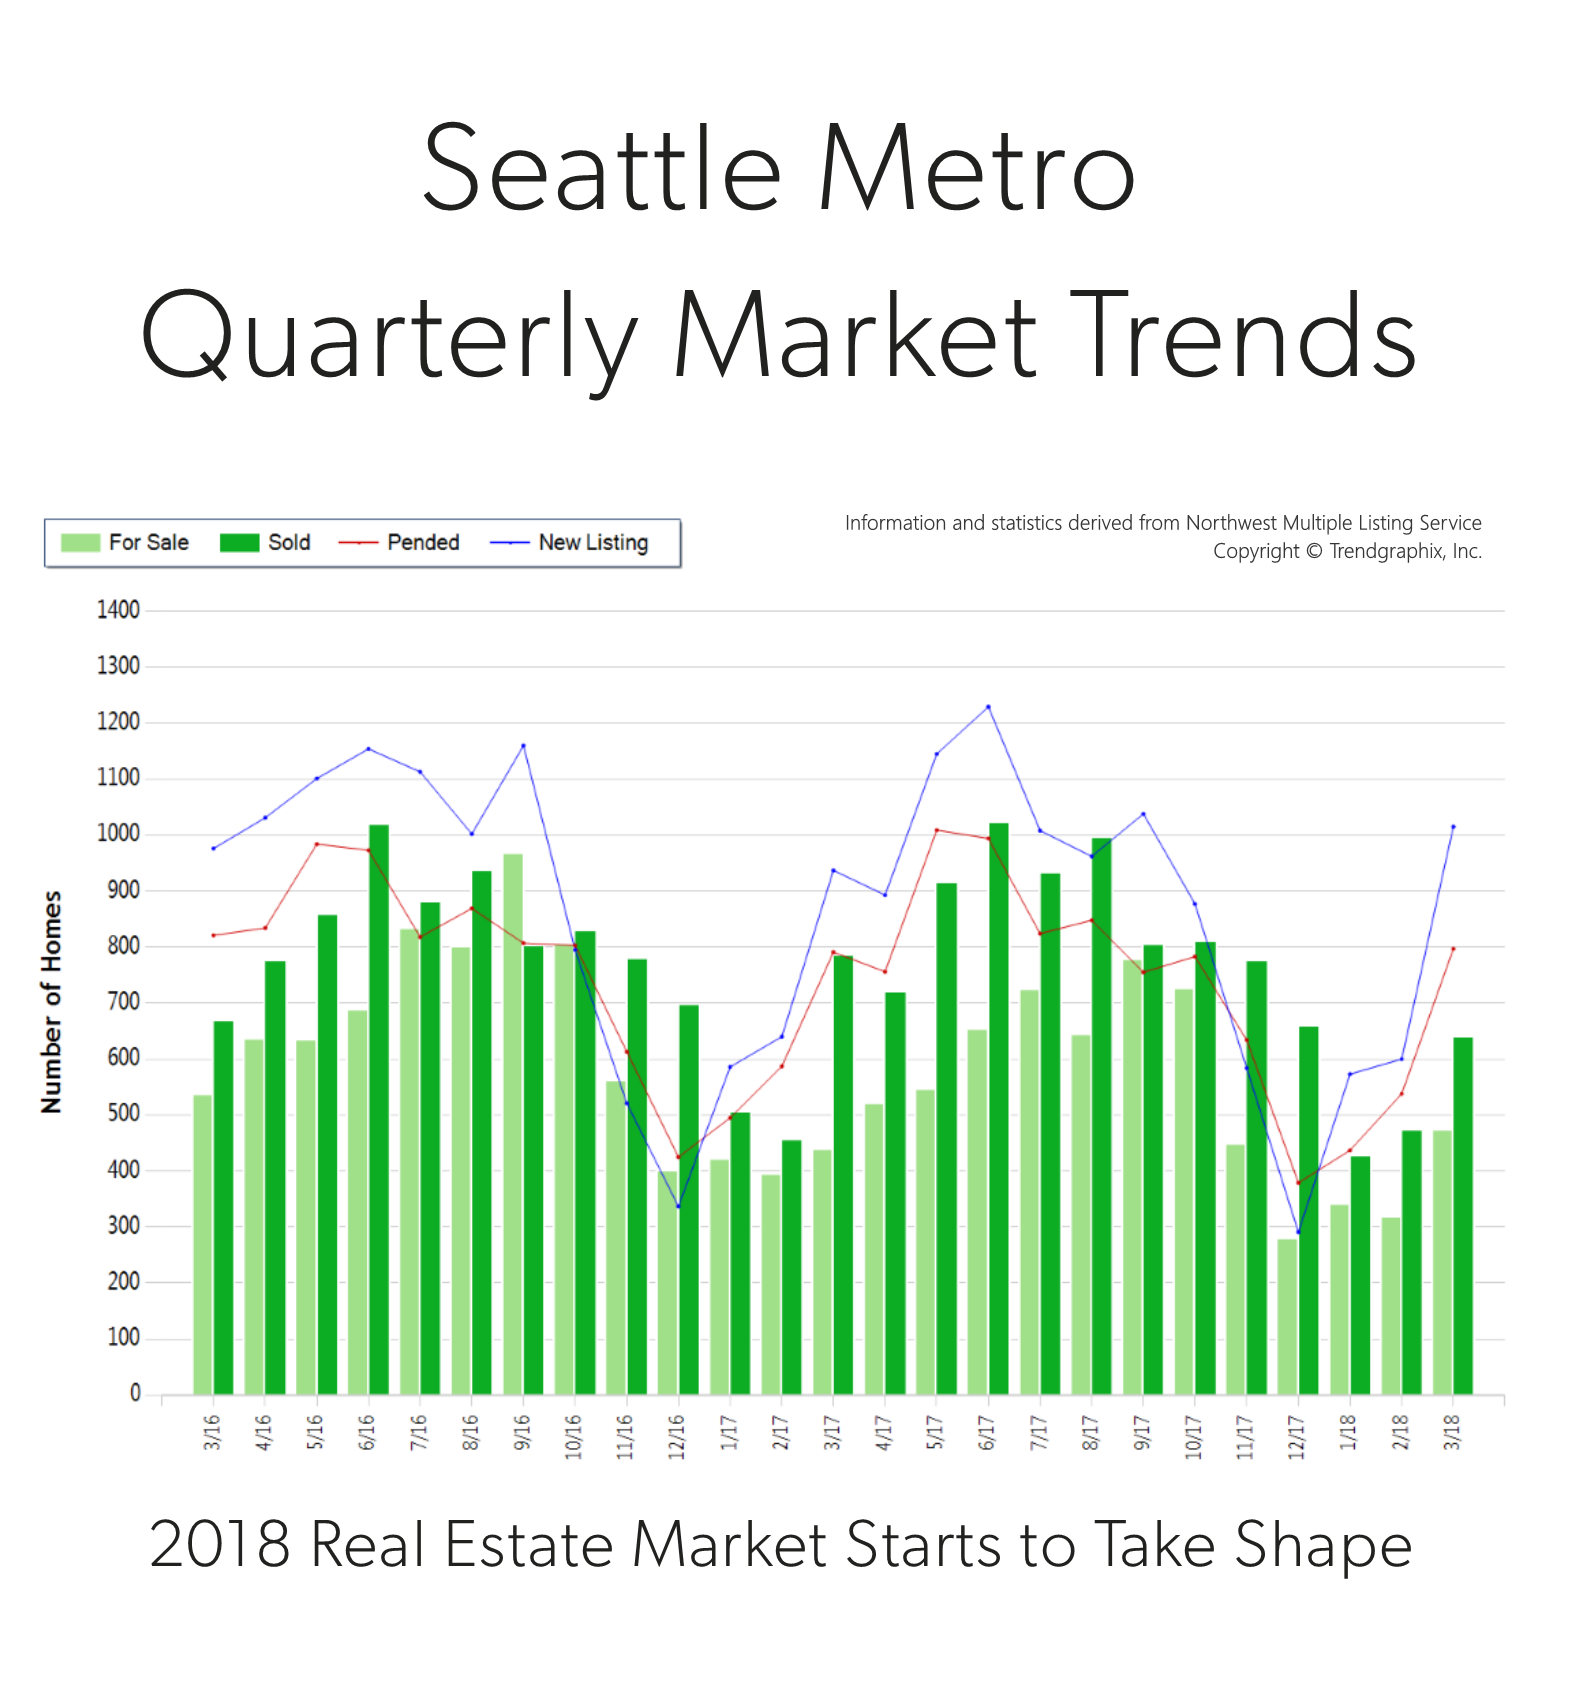
 It is the time of year when our market starts to take off. Spring is here and we are starting to see seasonal increases in inventory. In fact, there was a 69% increase in new listings in March compared to February. That increase was followed by a 48% rise in pending sales, illustrating very strong demand for housing in your area. Last month, the average list-to-sale price ratio (the amount the sale price topped the list price) was 105%, indicating that multiple offers were the norm. We ended the quarter with 0.6 months of inventory based on pending sales. More inventory would be absorbed by happy buyers looking for more selection and would help temper price growth, which is up 16% year-over-year.
Seattle Metro real estate has a very high premium due to close-in commute times and vibrant neighborhoods. In fact, the median price in March was $800,000, up 5% from the month prior! Sellers are enjoying amazing returns due to this phenomenon, and buyers are securing mortgages with minor debt service due to low interest rates. This is a very strong seller’s market, but buyers who are securing a home are already enjoying appreciation in equity.
This is only a snapshot of the trends in the Seattle Metro area; please contact me if you would like further explanation of how the latest trends relate to you.
Eastside Quarterly Market Trends
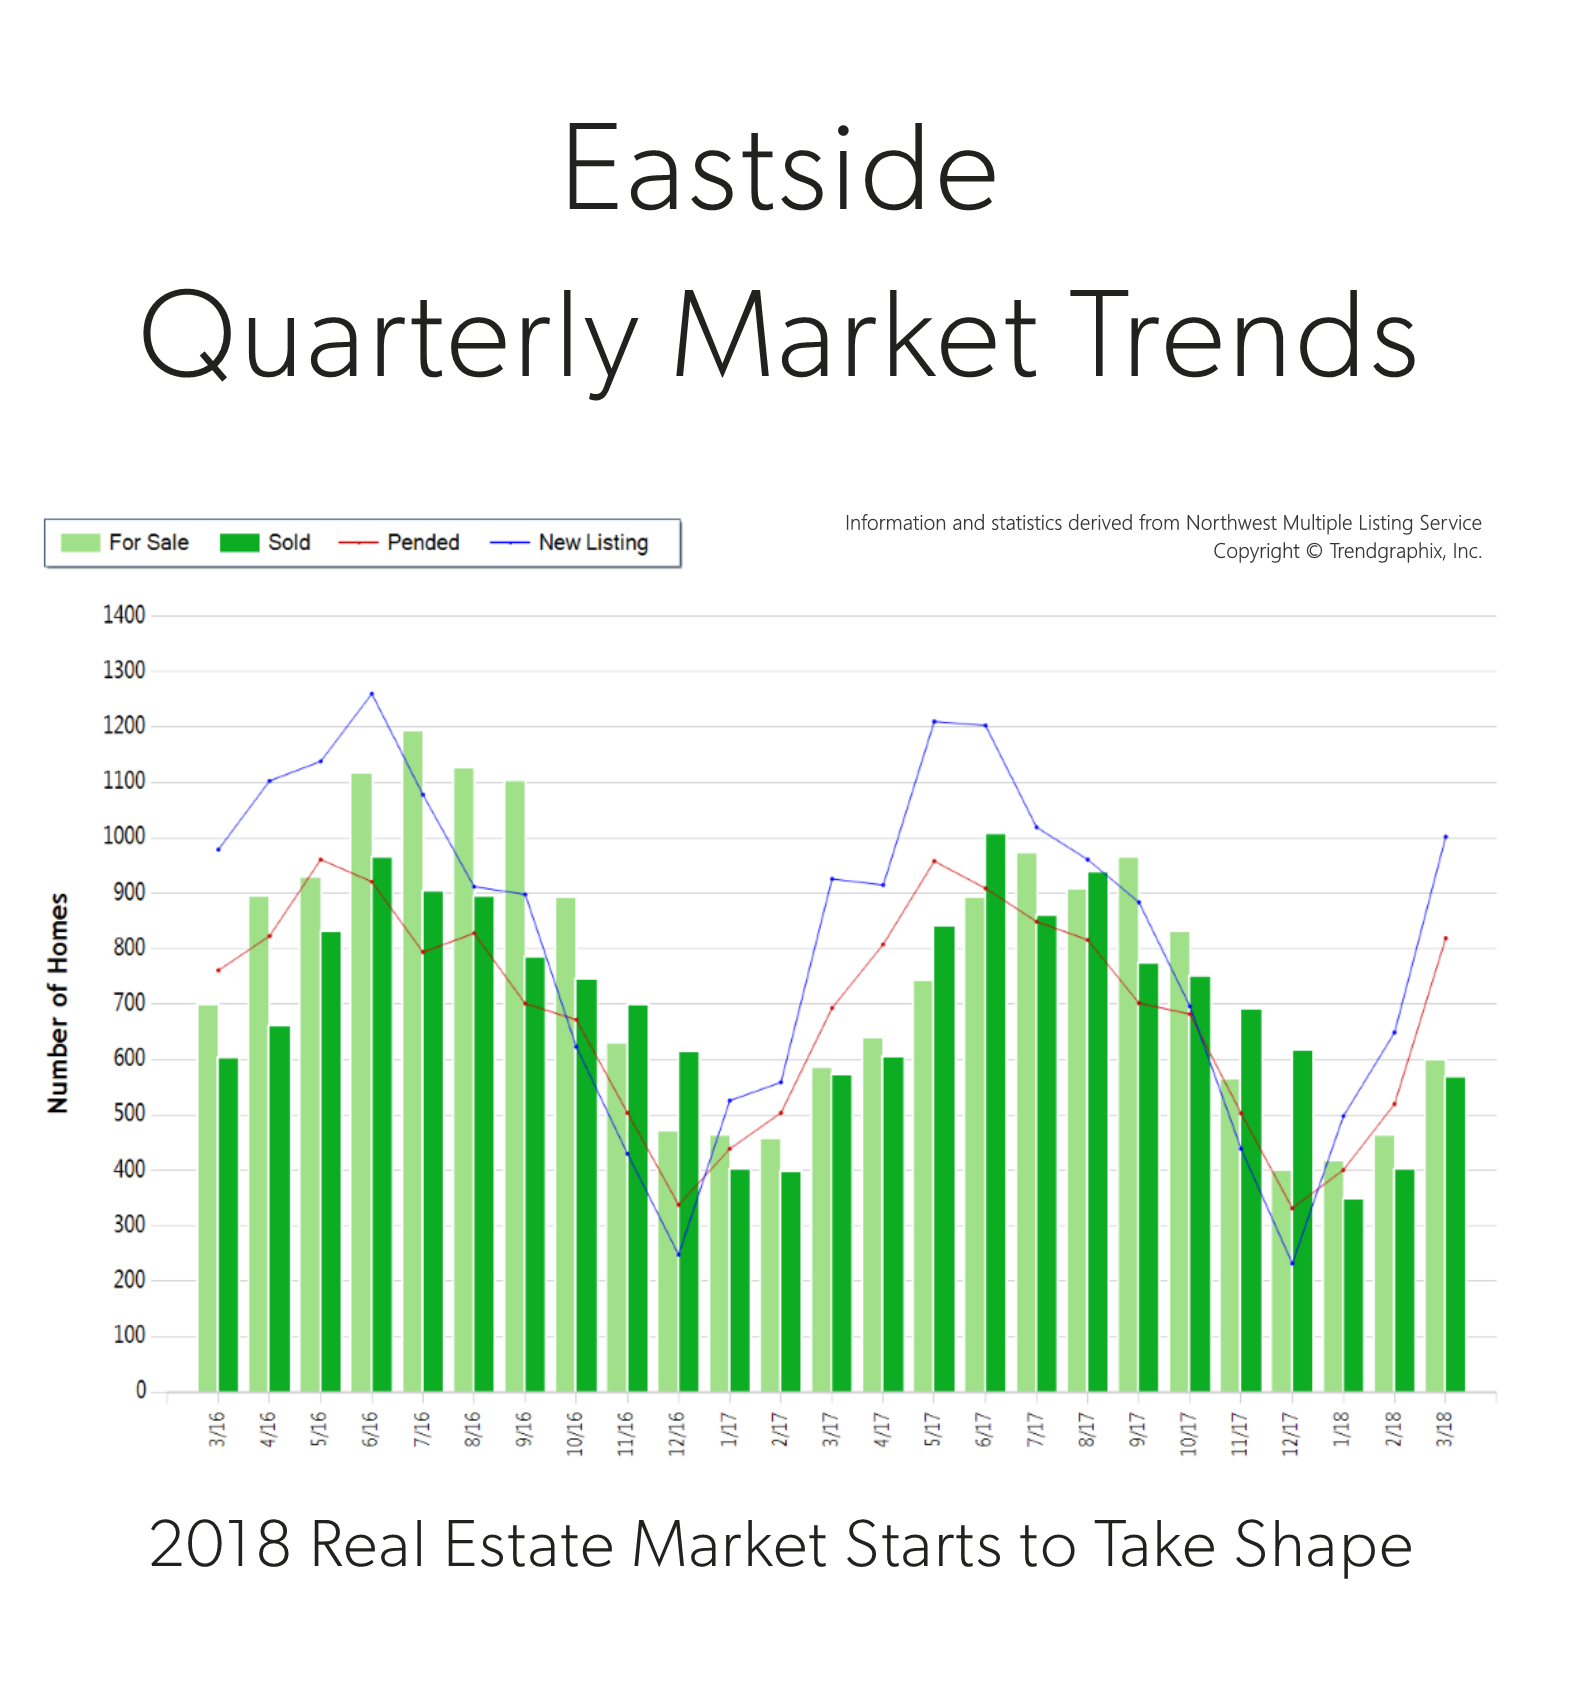
 It is the time of year when our market starts to take off. Spring is here and we are starting to see seasonal increases in inventory. In fact, there was a 54% increase in new listings in March compared to February. That increase was topped by a 58% rise in pending sales, illustrating very strong demand for housing in your area. Last month, the average list-to-sale price ratio (the amount the sale price topped the list price) was 103%, indicating that multiple offers were the norm. We ended the quarter with 0.7 months of inventory – the lowest level yet. More inventory would be absorbed by happy buyers looking for more selection and would help temper price growth, which is up 14% year-over-year.
Eastside real estate has a very high premium due to close-in commute times and desirable neighborhoods. In fact, the median price in March was $927,000! Sellers are enjoying amazing returns due to this phenomenon, and buyers are securing mortgages with minor debt service due to low interest rates. This is a very strong seller’s market, but buyers who are securing a home are already enjoying appreciation in equity.
This is only a snapshot of the trends on the Eastside area; please contact me if you would like further explanation of how the latest trends relate to you.
South King County Market Trends
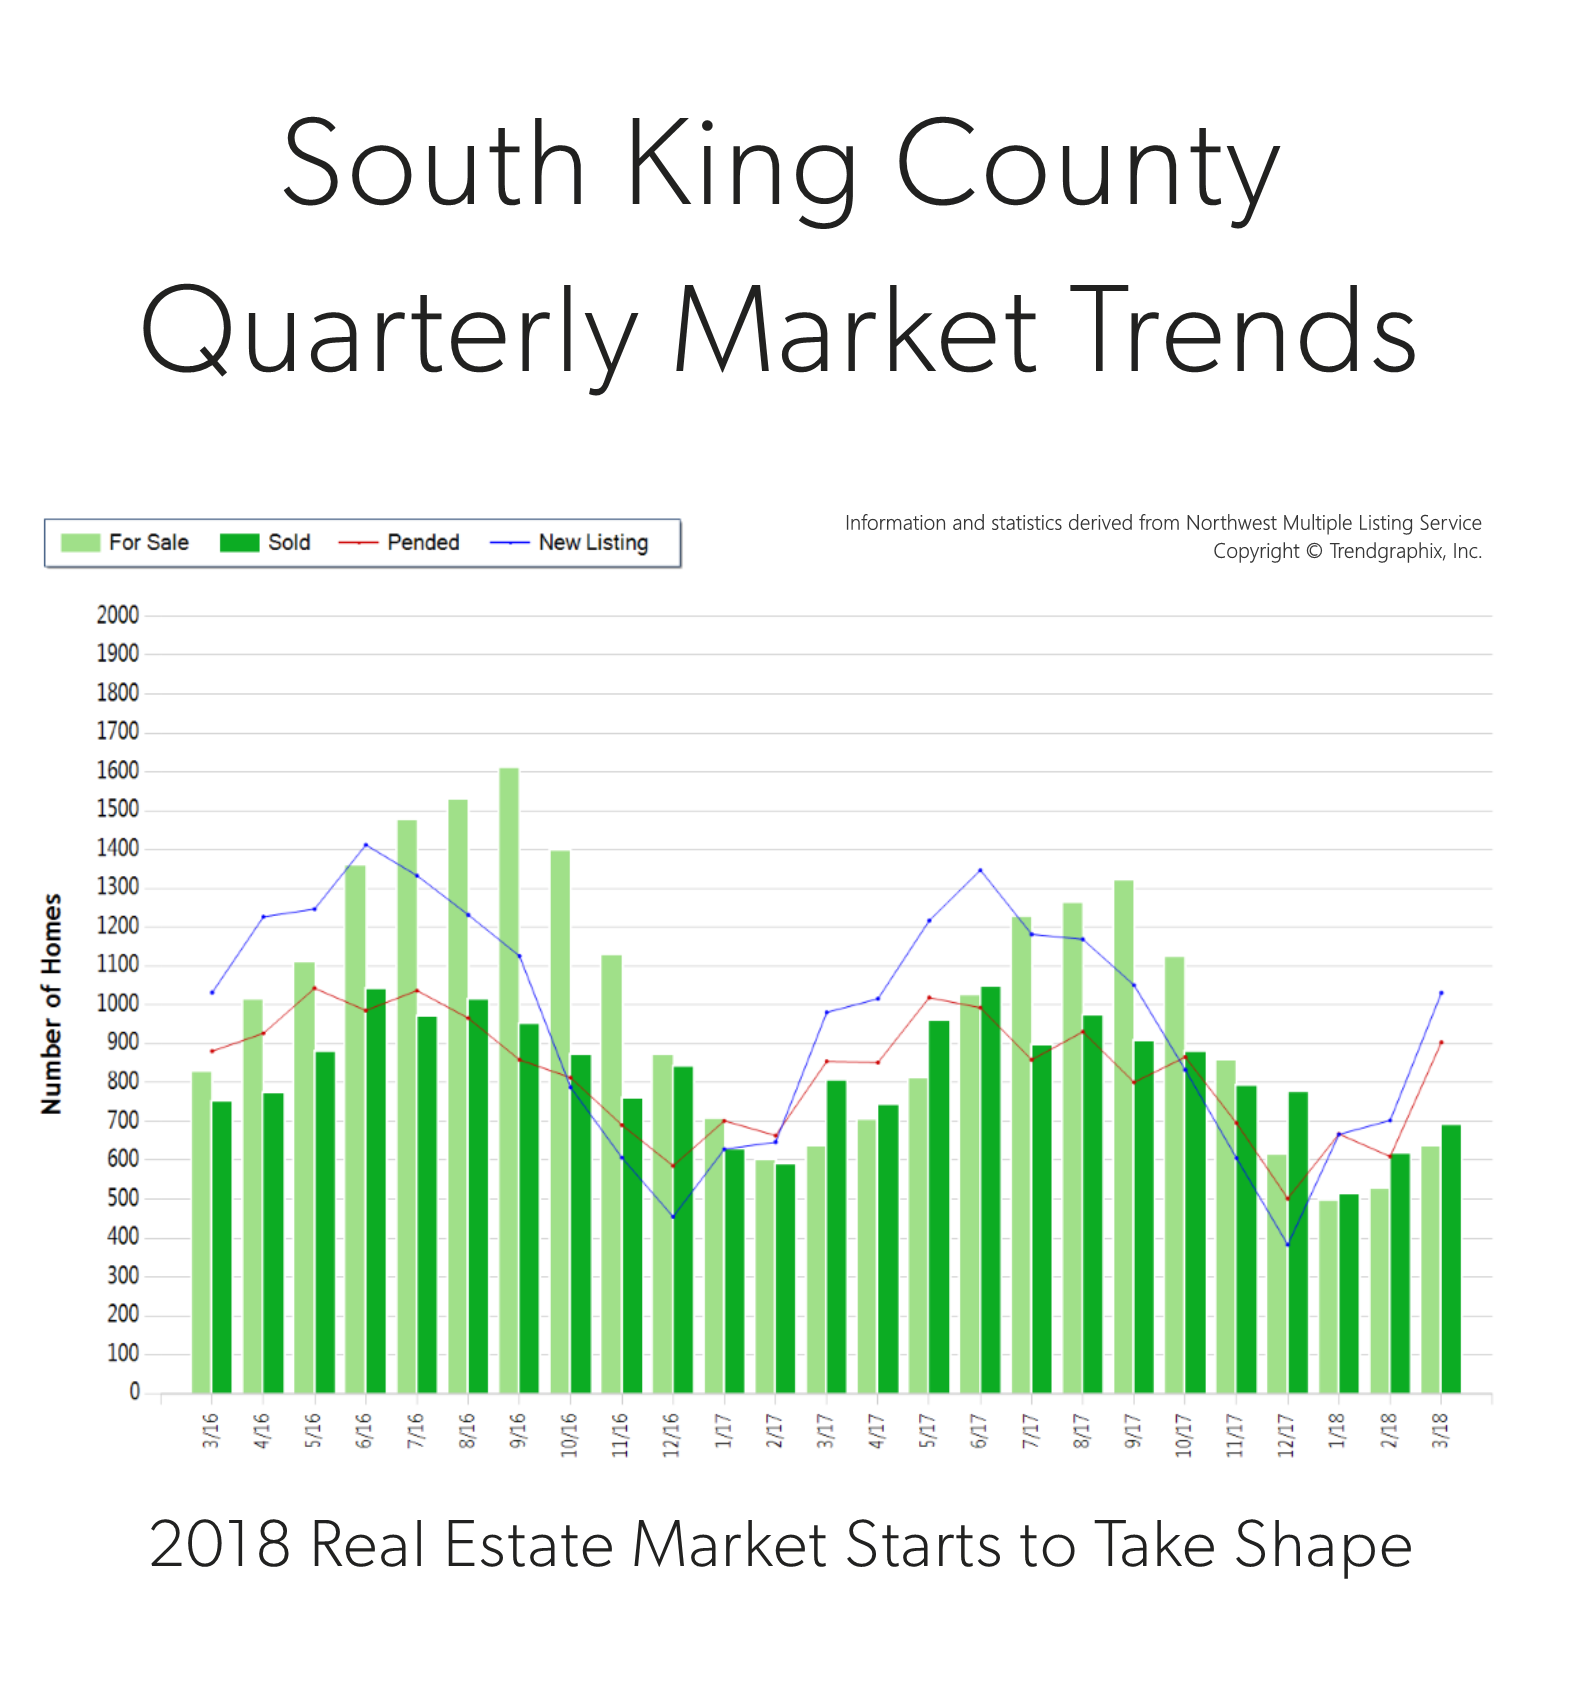

It is the time of year when our market starts to take off. Spring is here and we are starting to see seasonal increases in inventory. In fact, there was a 47% increase in new listings in March compared to February. That increase was matched by a 48% rise in pending sales, illustrating very strong demand for housing in your area. Last month, the average list-to-sale price ratio (the amount the sale price topped the list price) was 101%, indicating that multiple offers were the norm. We ended the quarter with 0.7 months of inventory – the lowest level yet. More inventory would be absorbed by happy buyers looking for more selection and would help temper price growth, which is up 12% year-over-year.
South King County real estate has been a hot spot due to reasonable commute times and overall affordability compared to “in-city” real estate. In fact, the median price in March was 78% higher in Seattle Metro. Sellers are enjoying amazing returns due to this phenomenon, and buyers are securing mortgages with minor debt service due to low interest rates. This is a very strong seller’s market, but buyers who are securing a home are already enjoying appreciation in equity.
This is only a snapshot of the trends in south King County; please contact me if you would like further explanation of how the latest trends relate to you.
Commute Times, Price Premiums: The Value of Location, Location, Location


Flickr Photo/SounderBruce (CC BY SA 2.0)/http://flic.kr/p/MzGznr
Commute Times, Price Premiums: The Value of Location, Location, Location
It is the time of year when I like to re-cap the price premiums in our area based on commute times. The price divide continued in 2017 between key market areas in the Greater Seattle area based on proximity to major job centers. These pricing premiums have cemented the drive-to-qualify market. Seattle proper has always been more expensive than its neighboring suburbs, but the most current prices illustrate the extreme value of a shorter commute.
In 2017, the average sales price for a single-family residential home in the Seattle Metro area was $801,000, up 14% from the year prior! In south Snohomish County (Everett to the King County line) the average sales price for a single-family residential home in 2017 was $543,000, up 12% from the year prior, however 48% less expensive than Seattle Metro.
Further, if you jump across Lake Washington to the Eastside, the average sales price in 2017 for a single-family residential home was $1,049,000, up 16% from the year prior and 31% more expensive than Seattle Metro! The Eastside has the infrastructure to support their own job centers, making it a second “Seattle”, with the benefit of newer and larger housing stock, which reflects the pricing. Many folks are living and working on the Eastside, or using the 520 toll bridge to jump over to Seattle.
In 2017, closed transactions were up 4% in south Snohomish County despite fewer new listings coming to market, which I think was driven by its affordability compared to Seattle and the Eastside. Snohomish County offers lower prices, larger houses and yards, new construction, lower taxes, strong school district options and longer, yet manageable commute times. Newer transit centers and telecommuting have also opened up doors to King County’s little brother to the north.
Another hot button that has continued to influence pricing is the future expansion of Light Rail and the locations of the planned stations. We have seen home values in these areas sell at a premium as consumers anticipate the shorter commute times the rail will bring. These neighborhoods are experiencing zoning changes now and the additional expansion is being phased in over the course of the next 15 years. There will be more multi-family and commercial development in these areas, creating more density to serve the public using these commuting services. This has created great appeal for homeowners that want to get in on the ease of nearby public transportation, and developers eager to be part of the infrastructure growth. Stations at Northgate, 145th & 185th in Shoreline, Mountlake Terrace and Lynnwood are all slated to open over the next 3-6 years.
No matter which neighborhood you are interested in learning about, in either King or Snohomish County, I am happy to provide a 2017 re-cap of that market. I work in both counties and understand each of their nuances. 2017 was another eventful year in real estate and we are looking for that to continue in 2018. With these strong market prices, we hope to see an increase in inventory levels, providing more options for buyers and allowing price growth to temper to sustainable levels. Check out the article below that touches on Matthew Gardner’s, Windermere’s Chief Economist, 2018 predictions for the national housing market. I attended his local forecast this week and if you’d like a copy of his presentation, outlining what he thinks is in store for our area, please email me. I’d be happy to forward it along and explain his findings. Here’s to a successful 2018!
Quarterly Report – North King County
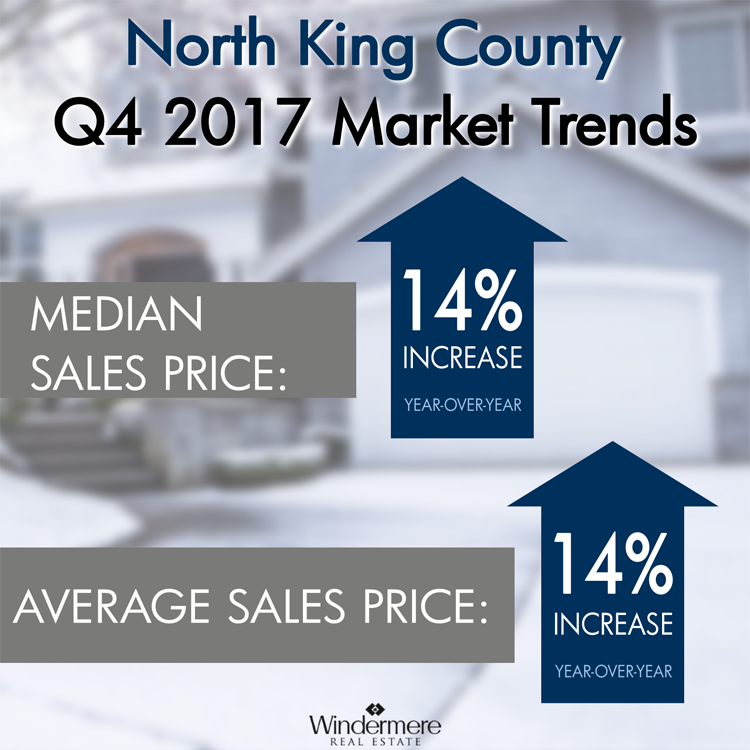

Price growth was particularly strong in 2017! Median and average prices were up 14% over 2016. Median price in 2017 landed at $715,000 and the average at $787,000. The average amount of days it took to sell a house in 2017 was 17 days, which is 19% faster than 2016. The average list-to-sale price ratio over the last year was 104%, with the spring months as high as 107%! In 2017, inventory growth continued to be a challenge, with a 4% decrease in new listings compared to 2016. Even with inventory limitations there were a near equal amount sales! This phenomenon illustrates strong buyer demand and a need for more listings.
Median & Average Prices up 14% Year-Over-Year
Demand for north King County real estate has grown due to close proximity to job centers while maintaining a neighborhood feel. Over the last year, north King County was 41% more expensive than south Snohomish County and 77% over south King County. Historically low interest rates continue to drive the market as well, they have helped offset the increase in prices. Sellers are enjoying great returns due to this phenomenon and buyers are securing mortgages with minor debt service.
This is only a snapshot of the trends in north King County; please contact me if you would like further explanation of how the latest trends relate to you.
The Gardner Report – Windermere Real Estate

ECONOMIC OVERVIEW
The Washington State economy added 104,600 new jobs over the past 12 months. This impressive growth rate of 3.1% is well above the national rate of 1.4%. Interestingly, the slowdown we saw through most of the second half of the year reversed in the fall, and we actually saw more robust employment growth.
Growth continues to be broad-based, with expansion in all major job sectors other than aerospace due to a slowdown at Boeing.
With job creation, the state unemployment rate stands at 4.5%, essentially indicating that the state is close to full employment. Additionally, all counties contained within this report show unemployment rates below where they were a year ago.
I expect continued economic expansion in Washington State in 2018; however, we are likely to see a modest slowdown, which is to be expected at this stage in the business cycle.
HOME SALES ACTIVITY
- There were 22,325 home sales during the final quarter of 2017. This is an increase of 3.7% over the same period in 2016.
- Jefferson County saw sales rise the fastest relative to fourth quarter of 2016, with an impressive increase of 22.8%. Six other counties saw double-digit gains in sales. A lack of listings impacted King and Skagit Counties, where sales fell.
- Housing inventory was down by 16.2% when compared to the fourth quarter of 2016, and down by 17.3% from last quarter. This isn’t terribly surprising since we typically see a slowdown as we enter the winter months. Pending home sales rose by 4.1% over the third quarter of 2017, suggesting that closings in the first quarter of 2018 should be robust.
- The takeaway from this data is that listings remain at very low levels and, unfortunately, I don’t expect to see substantial increases in 2018. The region is likely to remain somewhat starved for inventory for the foreseeable future.

HOME PRICES

- Because of low inventory in the fall of 2017, price growth was well above long-term averages across Western Washington. Year-over-year, average prices rose 12% to $466,726.
- Economic vitality in the region is leading to a demand for housing that far exceeds supply. Given the relative lack of newly constructed homes—something that is unlikely to change any time soon—there will continue to be pressure on the resale market. This means home prices will rise at above-average rates in 2018.
- Compared to the same period a year ago, price growth was most pronounced in Lewis County, where home prices were 18.8% higher than a year ago. Eleven additional counties experienced double-digit price growth as well.
- Mortgage rates in the fourth quarter rose very modestly, but remained below the four percent barrier. Although I anticipate rates will rise in 2018, the pace will be modest. My current forecast predicts an average 30-year rate of 4.4% in 2018—still remarkably low when compared to historic averages.

DAYS ON MARKET
- The average number of days it took to sell a home in the fourth quarter dropped by eight days, compared to the same quarter of 2016.
- King County continues to be the tightest market in Western Washington, with homes taking an average of 21 days to sell. Every county in the region saw the length of time it took to sell a home either drop or remain static relative to the same period a year ago.
- Last quarter, it took an average of 50 days to sell a home. This is down from 58 days in the fourth quarter of 2016, but up by 7 days from the third quarter of 2017.
- As mentioned earlier in this report, I expect inventory levels to rise modestly, which should lead to an increase in the average time it takes to sell a house. That said, with homes selling in less than two months on average, the market is nowhere near balanced.

CONCLUSIONS
 This speedometer reflects the state of the region’s housing market using housing inventory, price gains, home sales, interest rates, and larger economic factors. For the fourth quarter of 2017, I have left the needle at the same point as third quarter. Price growth remains robust even as sales activity slowed. 2018 is setting itself up to be another very good year for housing.

Matthew Gardner is the Chief Economist for Windermere Real Estate, specializing in residential market analysis, commercial/industrial market analysis, financial analysis, and land use and regional economics. He is the former Principal of Gardner Economics, and has more than 30 years of professional experience both in the U.S. and U.K.
Matthew Gardner’s 2018 Housing Forecast

In a nutshell, here is Matthew Gardner’s 2018 Housing Forecast. If you want to read his forecast in more detail, click here: http://bit.ly/2Cx1oSG

What Does Median Price Buy you in Each Area Around Puget Sound?
Recently the Seattle Times published an article about Seattle being the hottest real estate market in the country. This phenomenon has been taking place for over a year and experts don’t see this slowing down. According to the Case-Schiller Index, over the last 5 years since the market started to recover from the downturn, there has been an 80% increase in prices! I thought it would be interesting to take a look at the median price in each of our market areas to illustrate the price differentiation and affordability. If you are curious how this increase relates to your home, please contact me. It is my goal to help keep my clients informed and empower strong decisions.

North Snohomish County
Sale Price: $380,000
Bedrooms/Bathrooms: 3/2
Square Footage: 1,551
Year over Year Appreciation: 13%

South Snohomish County
Sale Price: $500,000
Bedrooms/Bathrooms: 3/1.75
Square Footage: 1,784
Year over Year Appreciation: 14%

North King County
Sale Price: $715,000
Bedrooms/Bathrooms: 3/1.75
Square Footage: 1,980
Year over Year Appreciation: 14%

Seattle Metro
Sale Price: $725,000
Bedrooms/Bathrooms: 3/1.75
Square Footage: 1,780
Year over Year Appreciation: 14%

Eastside
Sale Price: $855,000
Bedrooms/Bathrooms: 4/2.5
Square Footage: 2,170
Year over Year Appreciation: 14%

South King County
Sale Price: $400,000
Bedrooms/Bathrooms: 3/3.75
Square Footage: 2,400
Year over Year Appreciation: 13%
Tackle Homelessness

 Windermere is very proud to be the Official Real Estate Company of the Seattle Seahawks for the second year running! This Sunday we’ll be doing our part to #tacklehomelessness with the help of the Hawks. For every home game defensive tackle, Windermere donates $100 to YouthCare, an organization that provides critical services to homeless youth. So far this season we’ve already raised $10,700!
As a part of Windermere’s #TackleHomelessness campaign with the Seahawks, we are also collecting new hats, scarves, gloves and warm socks for YouthCare. Donations can be dropped off at my office through November. Each night in the greater Seattle area, nearly 1,000 young people are homeless, and this time of year can be especially harsh. Together we can make a difference.

3 Reasons Why We Are Not Headed Towards Another Real Estate Bubble


I get asked this question often, and I can understand why. With the 2008 Great Recession not too far back in our rear-view mirror it is understandable that folks don’t want history to repeat itself, as that was a very painful time for many. Also, price appreciation has been rapid across the country, but especially in our region. The large price gains might seem familiar to the gains of the previous up market of 2004-2007, but the environment is much different, and that is why we are not headed toward a housing collapse.
Lending Requirements
As the graph shows, lending requirements are much more stringent now than what they were prior to the fall of the housing market.

Previous lending practices allowed people to get into homes with risky debt-to-income ratios, low credit scores and undocumented incomes. They called this sub-prime lending. A large part of why the housing bubble burst 10 years ago was due to people getting into mortgages they were not equipped to handle, which lend to the eventual fall of sub-prime lending. Currently, the average credit score over the last 12 months according to Ellie Mae was 724. During the days of sub-prime lending people were funding loans with scores as low as 560! This, coupled with many zero-down loan programs and the risky terms mentioned above left many new homeowners with little to no equity. When you have little or no equity it very easy to just walk away.

The graph above shows the percentage of homes in our state with significant equity (20% or more) according to CoreLogic. Today many homeowners, especially in our region are making large down payments to begin with. Believe me, when reviewing multiple offers on a house, the size of down payment matters – hence many buyers landing homes are making large down payments. Unlike the market prior to the crash, when people have high equity levels they are not likely to abandon their home or miss payments.
Inventory Levels & Our Job Market
The biggest challenge in our market has been low inventory levels and high housing demand. It’s simply the concept of supply and demand. Our thriving job market has afforded folks already in our area the ability to make moves, and it is bringing people into our area from other parts of the country. Washington State’s net in-migration is 43% higher than it was 10 years ago. This has created increased demand, especially for homes closer to job centers resulting is shorter commutes. When you have increased demand and not enough homes to absorb the buyers, prices go up. Over the last three years we have easily seen a 10% increase in prices year-over-year. That is above the norm and should slow down as inventory increases. As inventory increases we anticipate a leveling out of appreciation rates to historical norms of 3-4% annually, but not decreasing home values like the 2008-2010 crash.
I understand that the recent increase in home prices has been big and that it might remind you of the previous up market before the crash. I hope that digging into the topics above has shed some light on how it is different. According to Matthew Gardner, Windermere’s Chief Economist and nationally sought after expert on all things real estate, buyers should not wait this market out, due to future price appreciation and today’s historically low interest rates. Check out his latest vlog (video blog) that addresses this topic.
As always, it is my goal to help keep my clients informed and empower strong decisions. Please let me know if I can answer any questions or help you or anyone you know with their real estate needs.

