It’s not too late! If you’re thinking about planting some fresh veggies but haven’t started yet, you still have time to get things in the ground for a late summer/early fall harvest. On average, the Puget Sound’s frost-free growing season is mid-March through mid-November, so with a little knowledge of when and how to start things, you can still see a bountiful harvest this year.
Some plants can be direct seeded into your garden, while others should be started indoors before being transplanted to your garden space. Deciding what to grow is the fun part! Plant what you like to eat, keeping in mind that some plants do better in our area than others.
Broccoli is arguably one of the most productive veggies you can grow in this area, although it can be vulnerable to root maggots and aphids. Giant Italian Parsley is easy to grow, highly productive, and expensive in the grocery store. Leeks are another that can be costly to buy in the store but trouble-free to grow in your own small space. Chard, Kale, Lettuce and Arugula are all full of vitamins and great for Northwest gardens. Carrots, Snap Peas, Snap Beans, Tomatoes and Basil all taste amazing fresh from the garden and grow relatively well in this area.
Check out the great resources at Garden.org for a full list of when to plant all these vegetables and more. They have detailed timelines for both spring and fall gardening; as well as information on transplanting seedlings vs. direct-sowing seeds.
The following analysis of the Western Washington real estate market is provided by Windermere Real Estate Chief Economist Matthew Gardner. We hope that this information may assist you with making better-informed real estate decisions. For further information about the housing market in your area, please don’t hesitate to contact me.
ECONOMIC OVERVIEW
The Washington State economy added 96,900 new jobs over the past 12 months, representing an annual growth rate of 2.9%—still solidly above the national rate of 1.5%. Most of the employment gains were in the private sector, which rose by 3.4%. The public sector saw a more modest increase of 1.6%.
The strongest growth was in the Education & Health Services and Retail sectors, which added 17,300 and 16,700 jobs, respectively. The Construction sector added 10,900 new positions over the past 12 months.
Even with solid increases in jobs, the state unemployment rate held steady at 4.7%—a figure that has not moved since September of last year.
I expect the Washington State economy to continue adding jobs in 2018, but not at the same rate as last year given that we are nearing full employment. That said, we will still outperform the nation as a whole when it comes to job creation.
HOME SALES ACTIVITY
There were 14,961 home sales during the first quarter of 2018. This is a drop of 5.4% over the same period in 2017.
Clallam County saw sales rise the fastest relative to the first quarter of 2017, with an increase of 16.5%. In most of the other markets, the lack of available homes for sale slowed the number of closings during this period.
Listing inventory in the quarter was down by 17.6% when compared to the first quarter of 2017, but pending home sales rose by 2.6% over the same period, suggesting that closings in the second quarter should be fairly robust.
The takeaway from this data is that the lack of supply continues to put a damper on sales. I also believe that the rise in interest rates in the finalquarter of 2017 likely pulled sales forward, leading to a drop in sales in the first quarter of 2018.
HOME PRICES
With ongoing limited inventory, it’s not surprising that the growth in home prices continues to trend well above the long-term average. Year-over-year, average prices rose 14.4% to $468,312.
Economic vitality in the region is leading to robust housing demand that far exceeds supply. Given the relative lack of new construction homes— something that is unlikely to change any time soon—there will continue to be pressure on the resale market. As a result, home prices will continue to rise at above-average rates in the coming year.
When compared to the same period a year ago, price growth was strongest in Grays Harbor County at 27.5%. Ten additional counties experienced double-digit price growth.
Mortgage rates continued to rise during first quarter, and are expected to increase modestly in the coming months. By the end of the year, interest rates will likely land around 4.9%, which should take some of the steam out of price growth. This is actually a good thing and should help address the challenges we face with housing affordability—especially in markets near the major job centers.
DAYS ON MARKET
The average number of days it took to sell a home dropped by seven days when compared to the same quarter of 2017.
King County continues to be the tightest market in Western Washington, with homes taking an average of 24 days to sell. Every county in the region saw the length of time it took to sell a home either drop or remain essentially static relative to the same period a year ago.
In looking at the entire region, it took an average of 61 days to sell a home in the first quarter of this year. This is down from 68 days in the firstquarter of 2017 but up by eleven days when compared to the fourth quarter of 2017.
Anyone expecting to see a rapid rise in the number of homes for sale in 2018 will likely be disappointed. New construction permit activity—a leading indicator—remains well below historic levels and this will continue to put increasing pressure on the resale home market.
CONCLUSIONS
This speedometer reflects the state of the region’s housing market using housing inventory, price gains, home sales, interest rates, and larger economic factors. For the first quarter of 2018, I have left the needle at the same point as fourth quarter of last year. Price growth remains strong even as sales activity slowed. All things being equal, 2018 is setting itself up to be another very good year for sellers but, unfortunately, not for buyers who will still see stiff competition for the limited number of available homes for sale.
Mr. Gardner is the Chief Economist for Windermere Real Estate, specializing in residential market analysis, commercial/industrial market analysis, financial analysis, and land use and regional economics. He is the former Principal of Gardner Economics, and has more than 30 years of professional experience both in the U.S. and U.K.
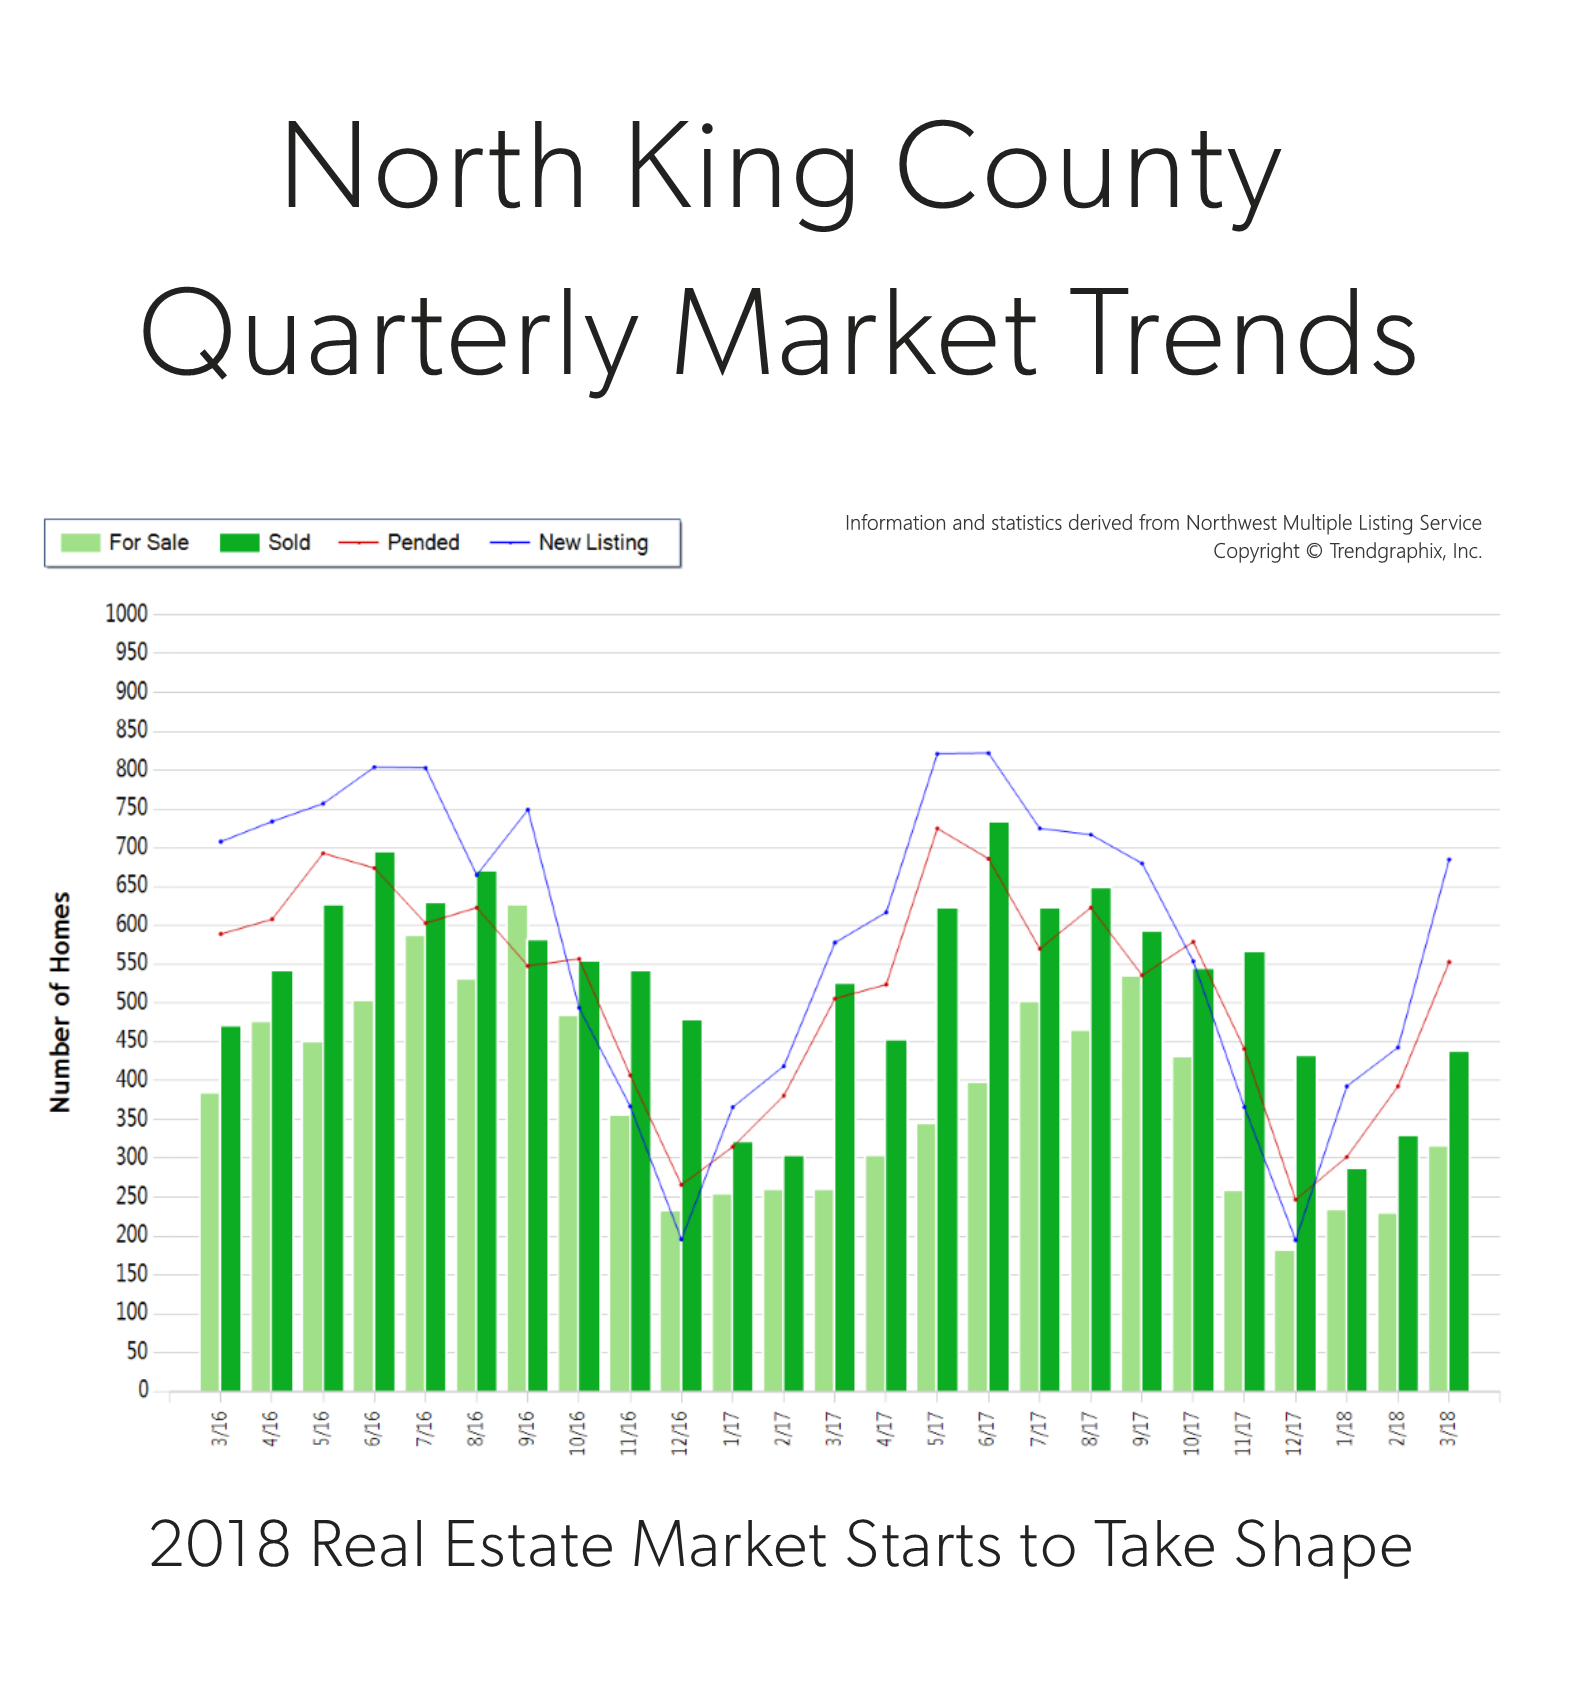
It is the time of year when our market starts to take off. Spring is here and we are starting to see seasonal increases in inventory. In fact, there was a 55% increase in new listings in March compared to February. That increase was followed by a 41% rise in pending sales, illustrating very strong demand for housing in your area. Last month, the average list-to-sale price ratio (the amount the sale price topped the list price) was 106%, indicating that multiple offers were the norm. We ended the quarter with 0.6 months of inventory based on pending sales. More inventory would be absorbed by happy buyers looking for more selection and would help temper price growth, which is up 14% year-over-year.
North King County real estate has a very high premium due to close-in commute times and desirable neighborhoods. In fact, the median price in March was $808,000, up 4% from the month prior! Sellers are enjoying amazing returns due to this phenomenon, and buyers are securing mortgages with minor debt service due to low interest rates. This is a very strong seller’s market, but buyers who are securing a home are already enjoying appreciation in equity.
This is only a snapshot of the trends in north King County; please contact me if you would like further explanation of how the latest trends relate to you.
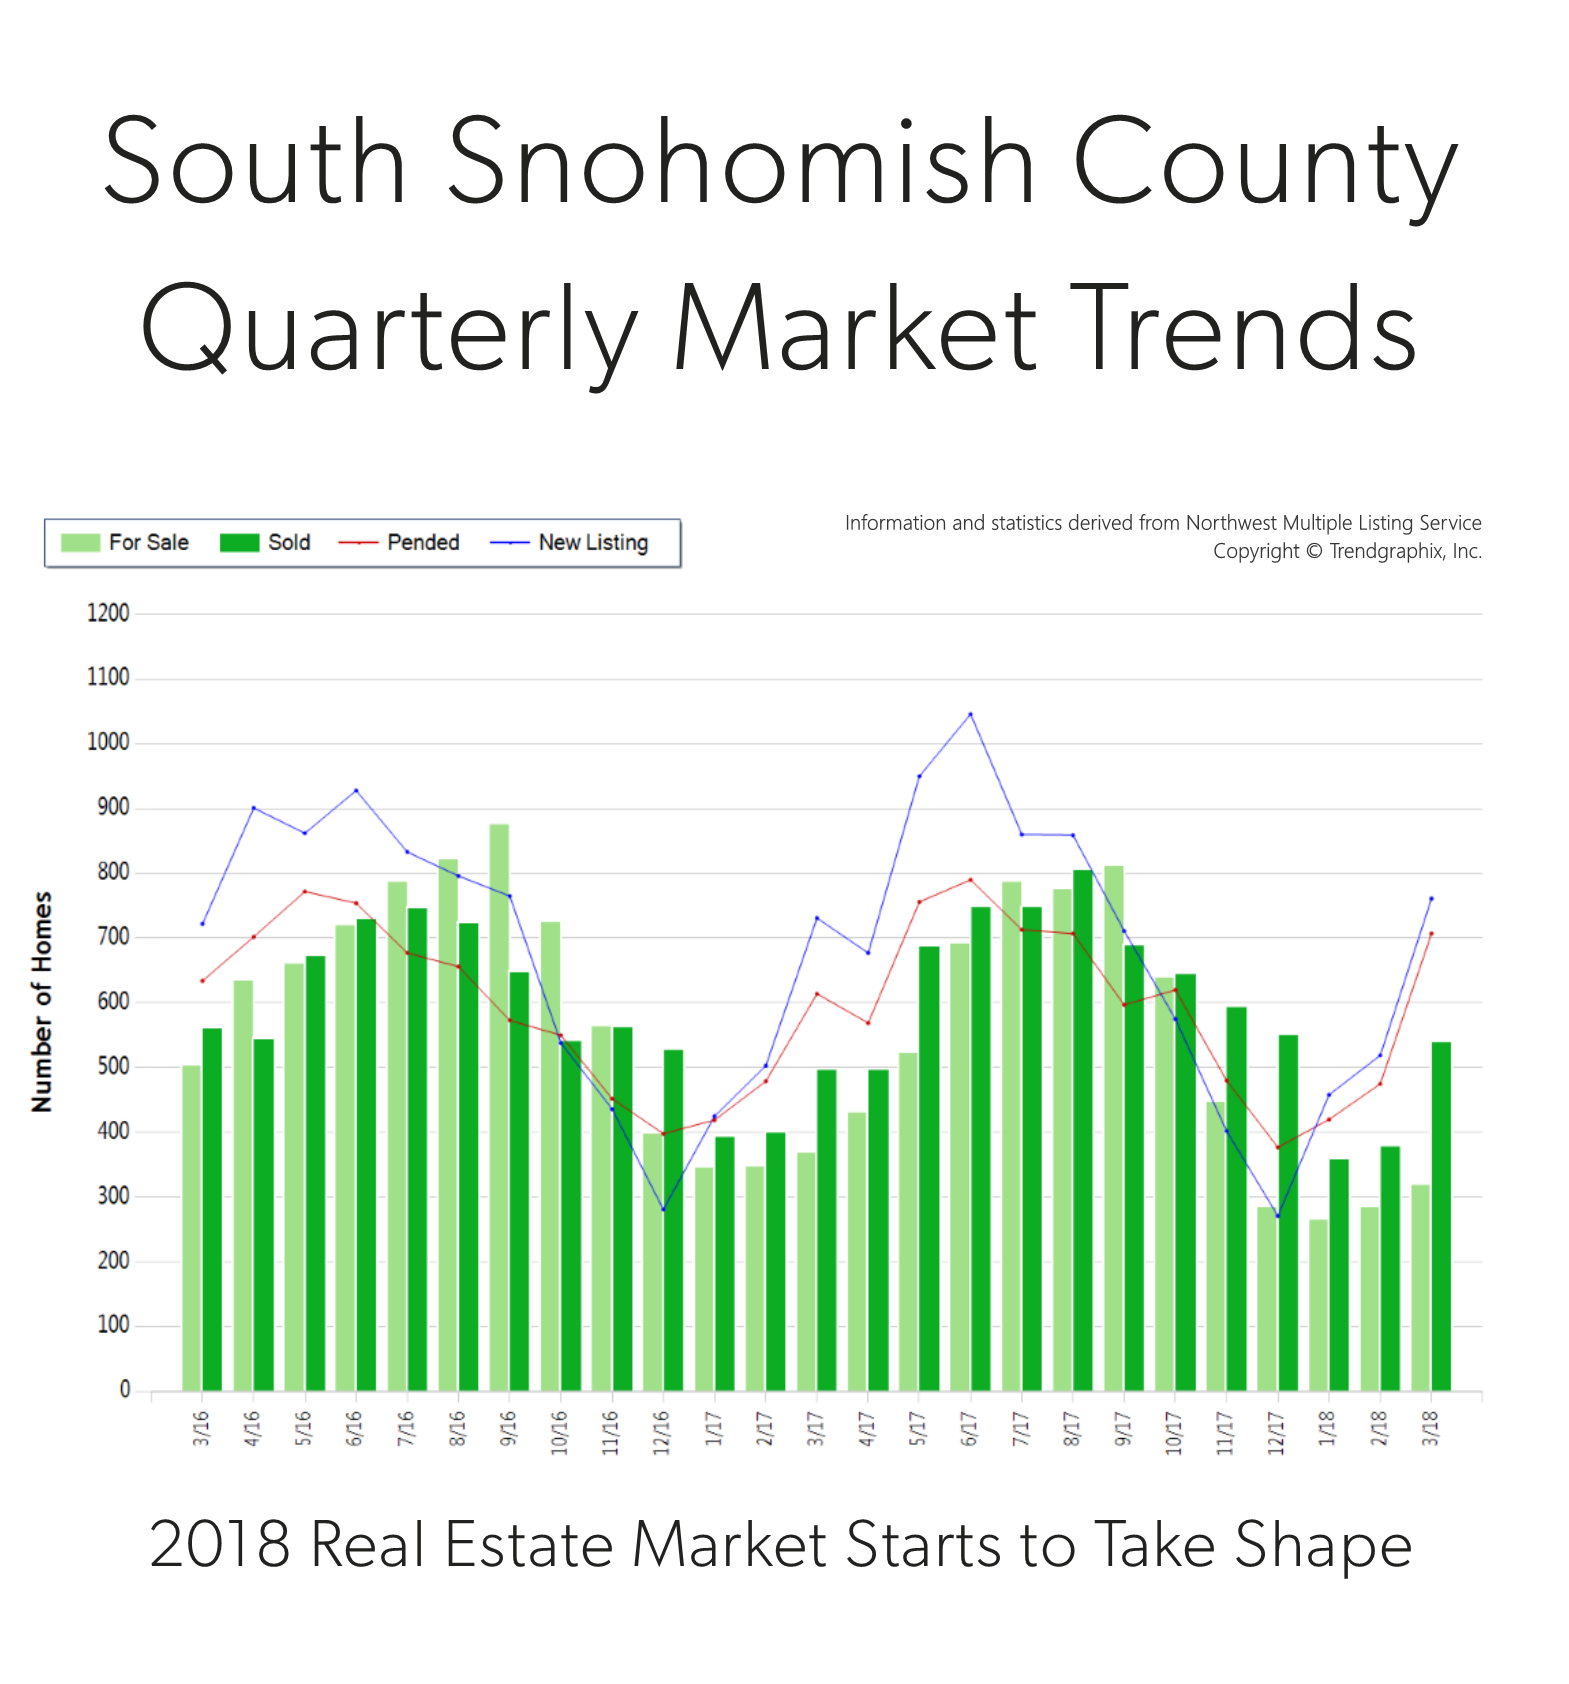
It is the time of year when our market starts to take off. Spring is here and we are starting to see seasonal increases in inventory. In fact, there was a 47% increase in new listings in March compared to February. That increase was matched by a 48% rise in pending sales, illustrating very strong demand for housing in your area. Last month, the average list-to-sale price ratio (the amount the sale price topped the list price) was 103%, indicating that multiple offers were the norm. We ended the quarter with 0.5 months of inventory – the lowest level yet. More inventory would be absorbed by happy buyers looking for more selection and would help temper price growth, which is up 15% year-over-year.
South Snohomish County real estate has been a hot spot due to reasonable commute times and overall affordability compared to “in-city” real estate. In fact, the median price in March was 47% higher in Seattle Metro. Sellers are enjoying amazing returns due to this phenomenon, and buyers are securing mortgages with minor debt service due to low interest rates. This is a very strong seller’s market, but buyers who are securing a home are already enjoying appreciation in equity.
This is only a snapshot of the trends in south Snohomish County; please contact me if you would like further explanation of how the latest trends relate to you.
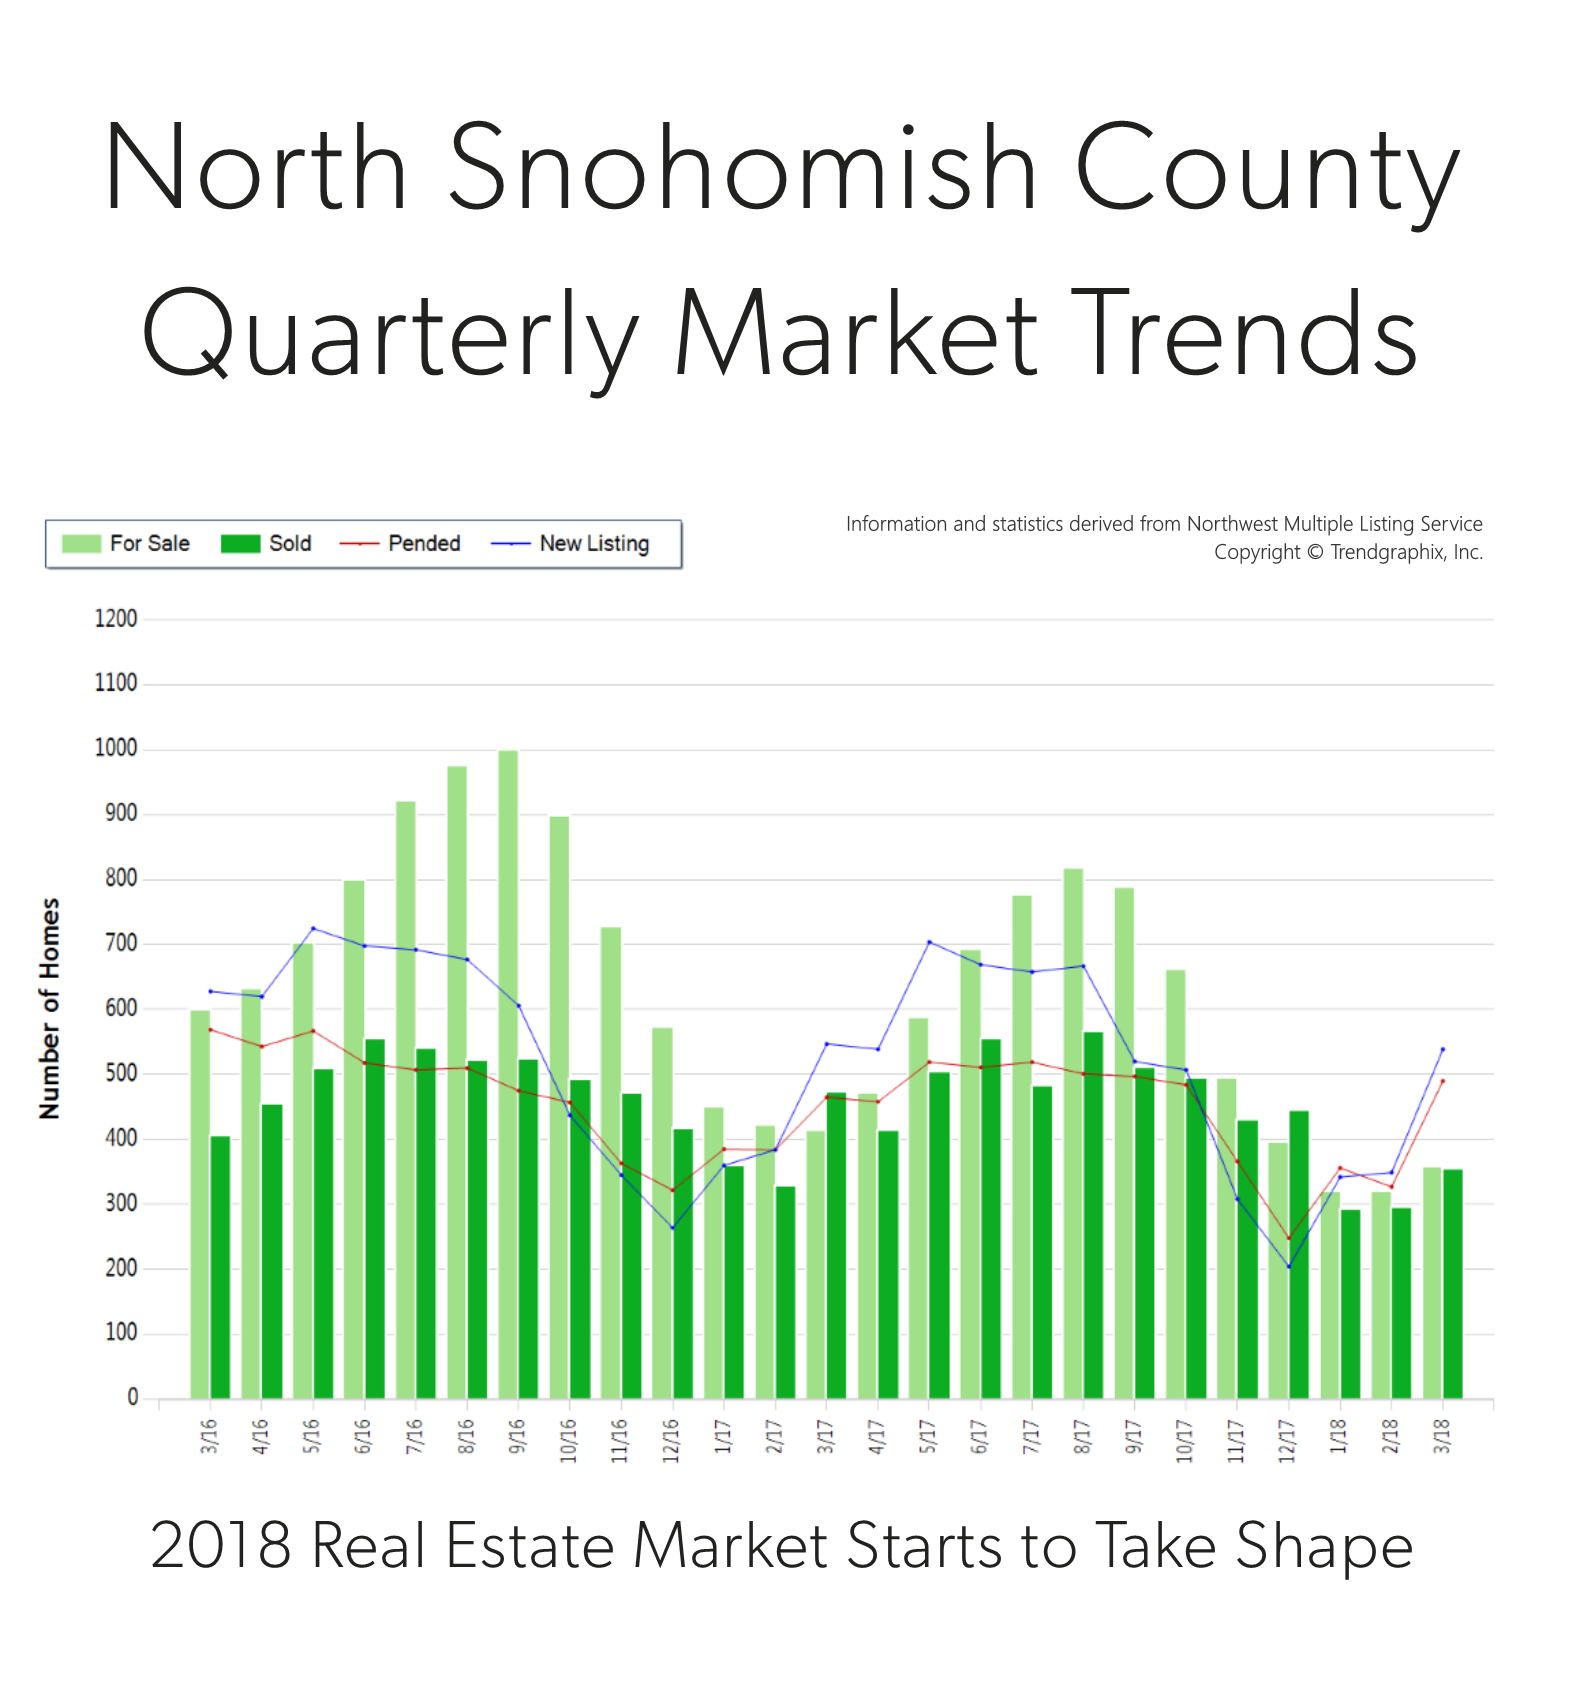
It is the time of year when our market starts to take off. Spring is here and we are starting to see seasonal increases in inventory. In fact, there was a 54% increase in new listings in March compared to February. That increase was matched by a 50% rise in pending sales, illustrating very strong demand for housing in your area. Last month, the average list-to-sale price ratio was 100%, and average days on market was 35 days. We ended the quarter with 0.7 months of inventory – the lowest level yet. More inventory would be absorbed by happy buyers looking for more selection and would help temper price growth, which is up 12% year-over-year.
North Snohomish County is one of the most affordable markets in the area. In fact, the median price in March was 28% higher in south Snohomish County. Buyers are migrating to the area, especially if they don’t have to commute into the city. Sellers are enjoying amazing returns due to this phenomenon, and buyers are securing mortgages with minor debt service due to low interest rates. This is a very strong seller’s market, but buyers who are securing a home are already enjoying appreciation in equity.
This is only a snapshot of the trends in north Snohomish County; please contact me if you would like further explanation of how the latest trends relate to you.
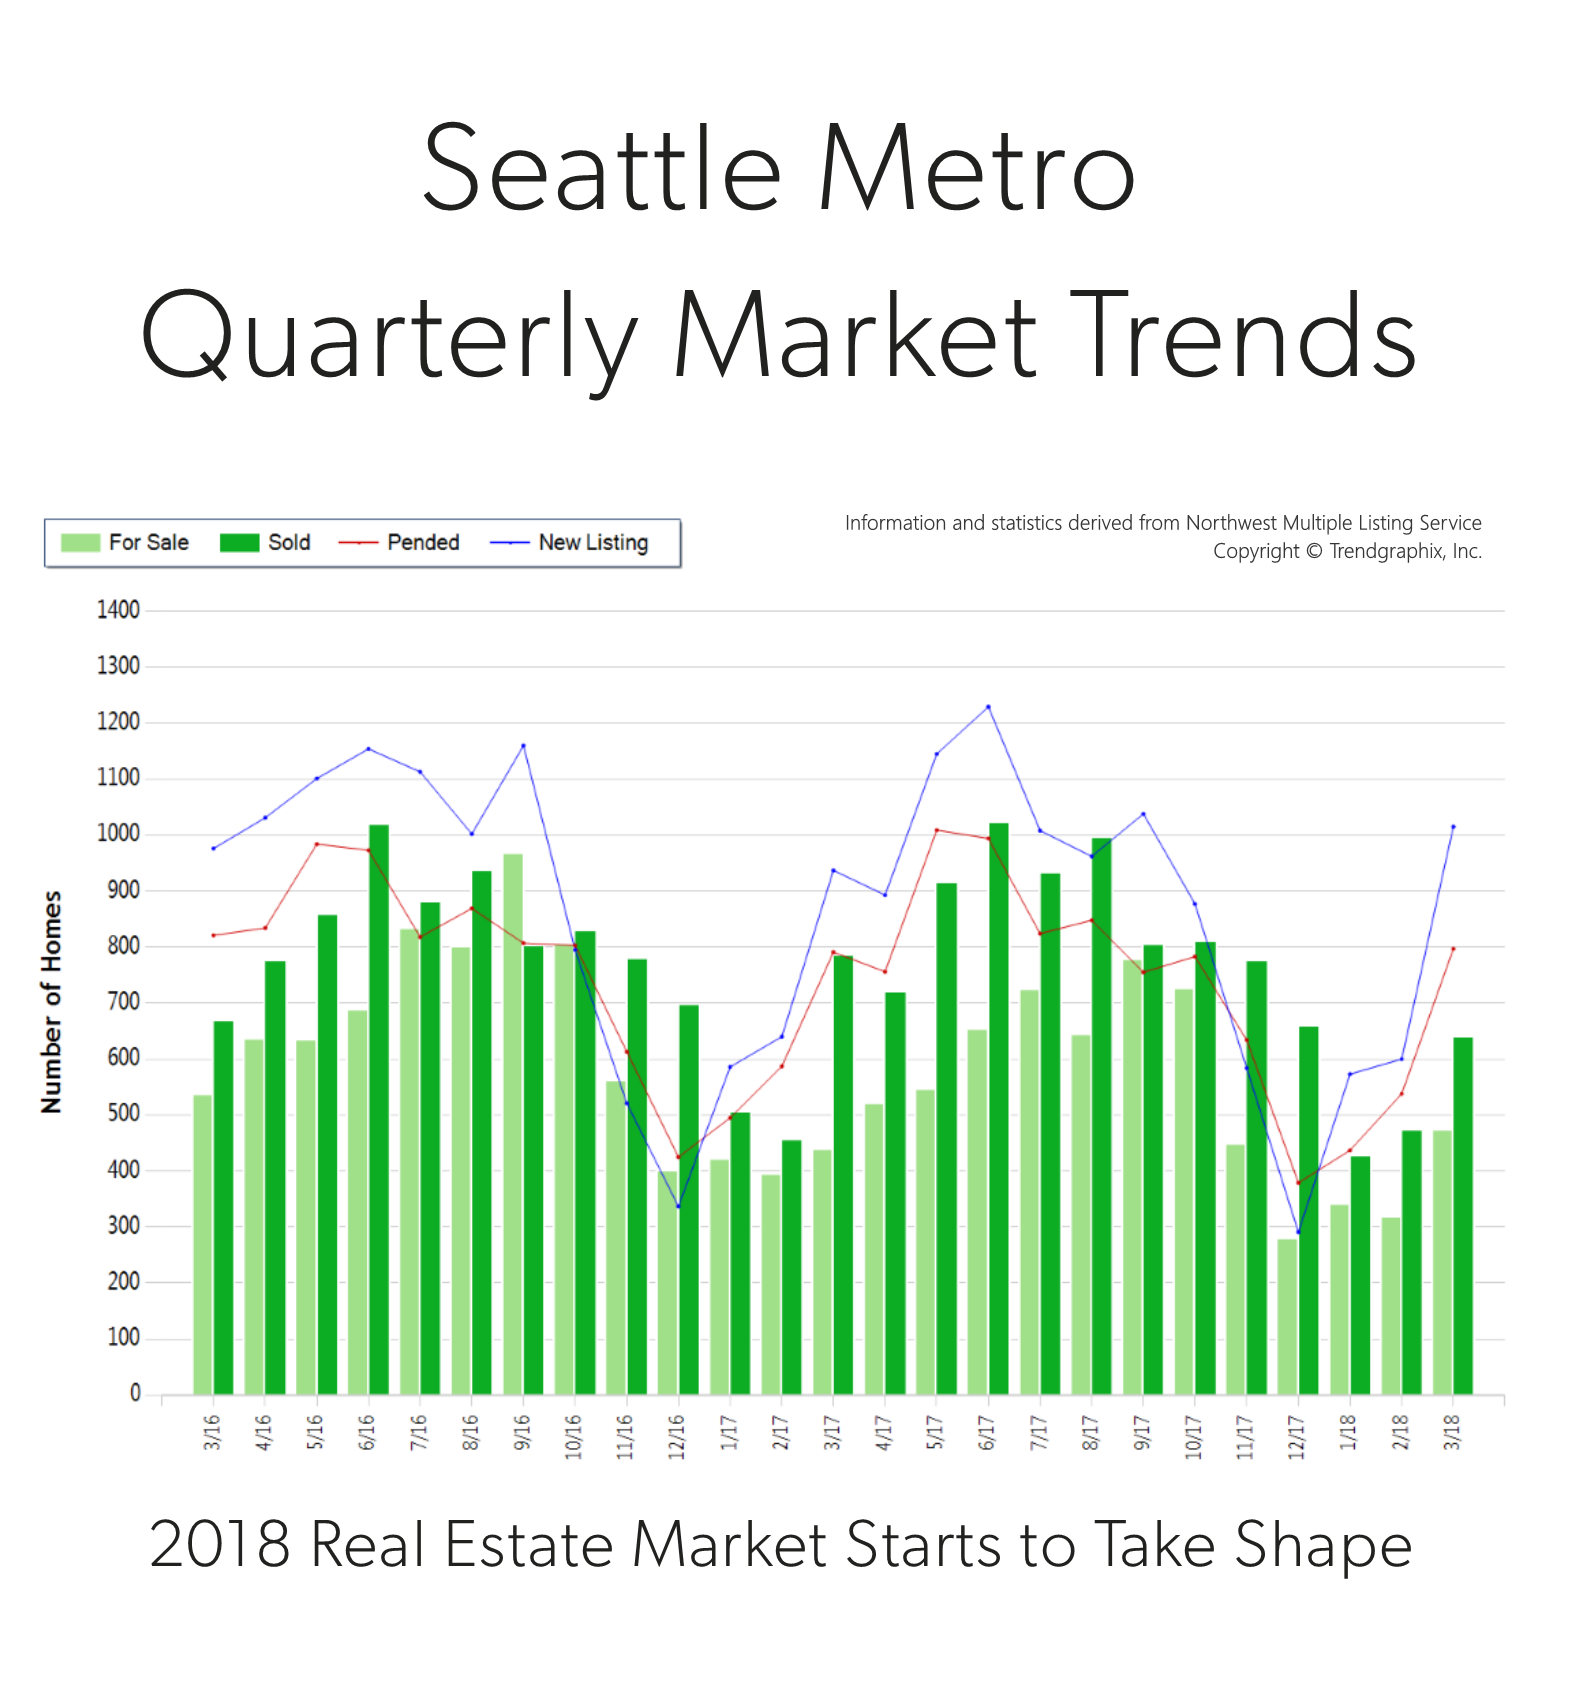
It is the time of year when our market starts to take off. Spring is here and we are starting to see seasonal increases in inventory. In fact, there was a 69% increase in new listings in March compared to February. That increase was followed by a 48% rise in pending sales, illustrating very strong demand for housing in your area. Last month, the average list-to-sale price ratio (the amount the sale price topped the list price) was 105%, indicating that multiple offers were the norm. We ended the quarter with 0.6 months of inventory based on pending sales. More inventory would be absorbed by happy buyers looking for more selection and would help temper price growth, which is up 16% year-over-year.
Seattle Metro real estate has a very high premium due to close-in commute times and vibrant neighborhoods. In fact, the median price in March was $800,000, up 5% from the month prior! Sellers are enjoying amazing returns due to this phenomenon, and buyers are securing mortgages with minor debt service due to low interest rates. This is a very strong seller’s market, but buyers who are securing a home are already enjoying appreciation in equity.
This is only a snapshot of the trends in the Seattle Metro area; please contact me if you would like further explanation of how the latest trends relate to you.
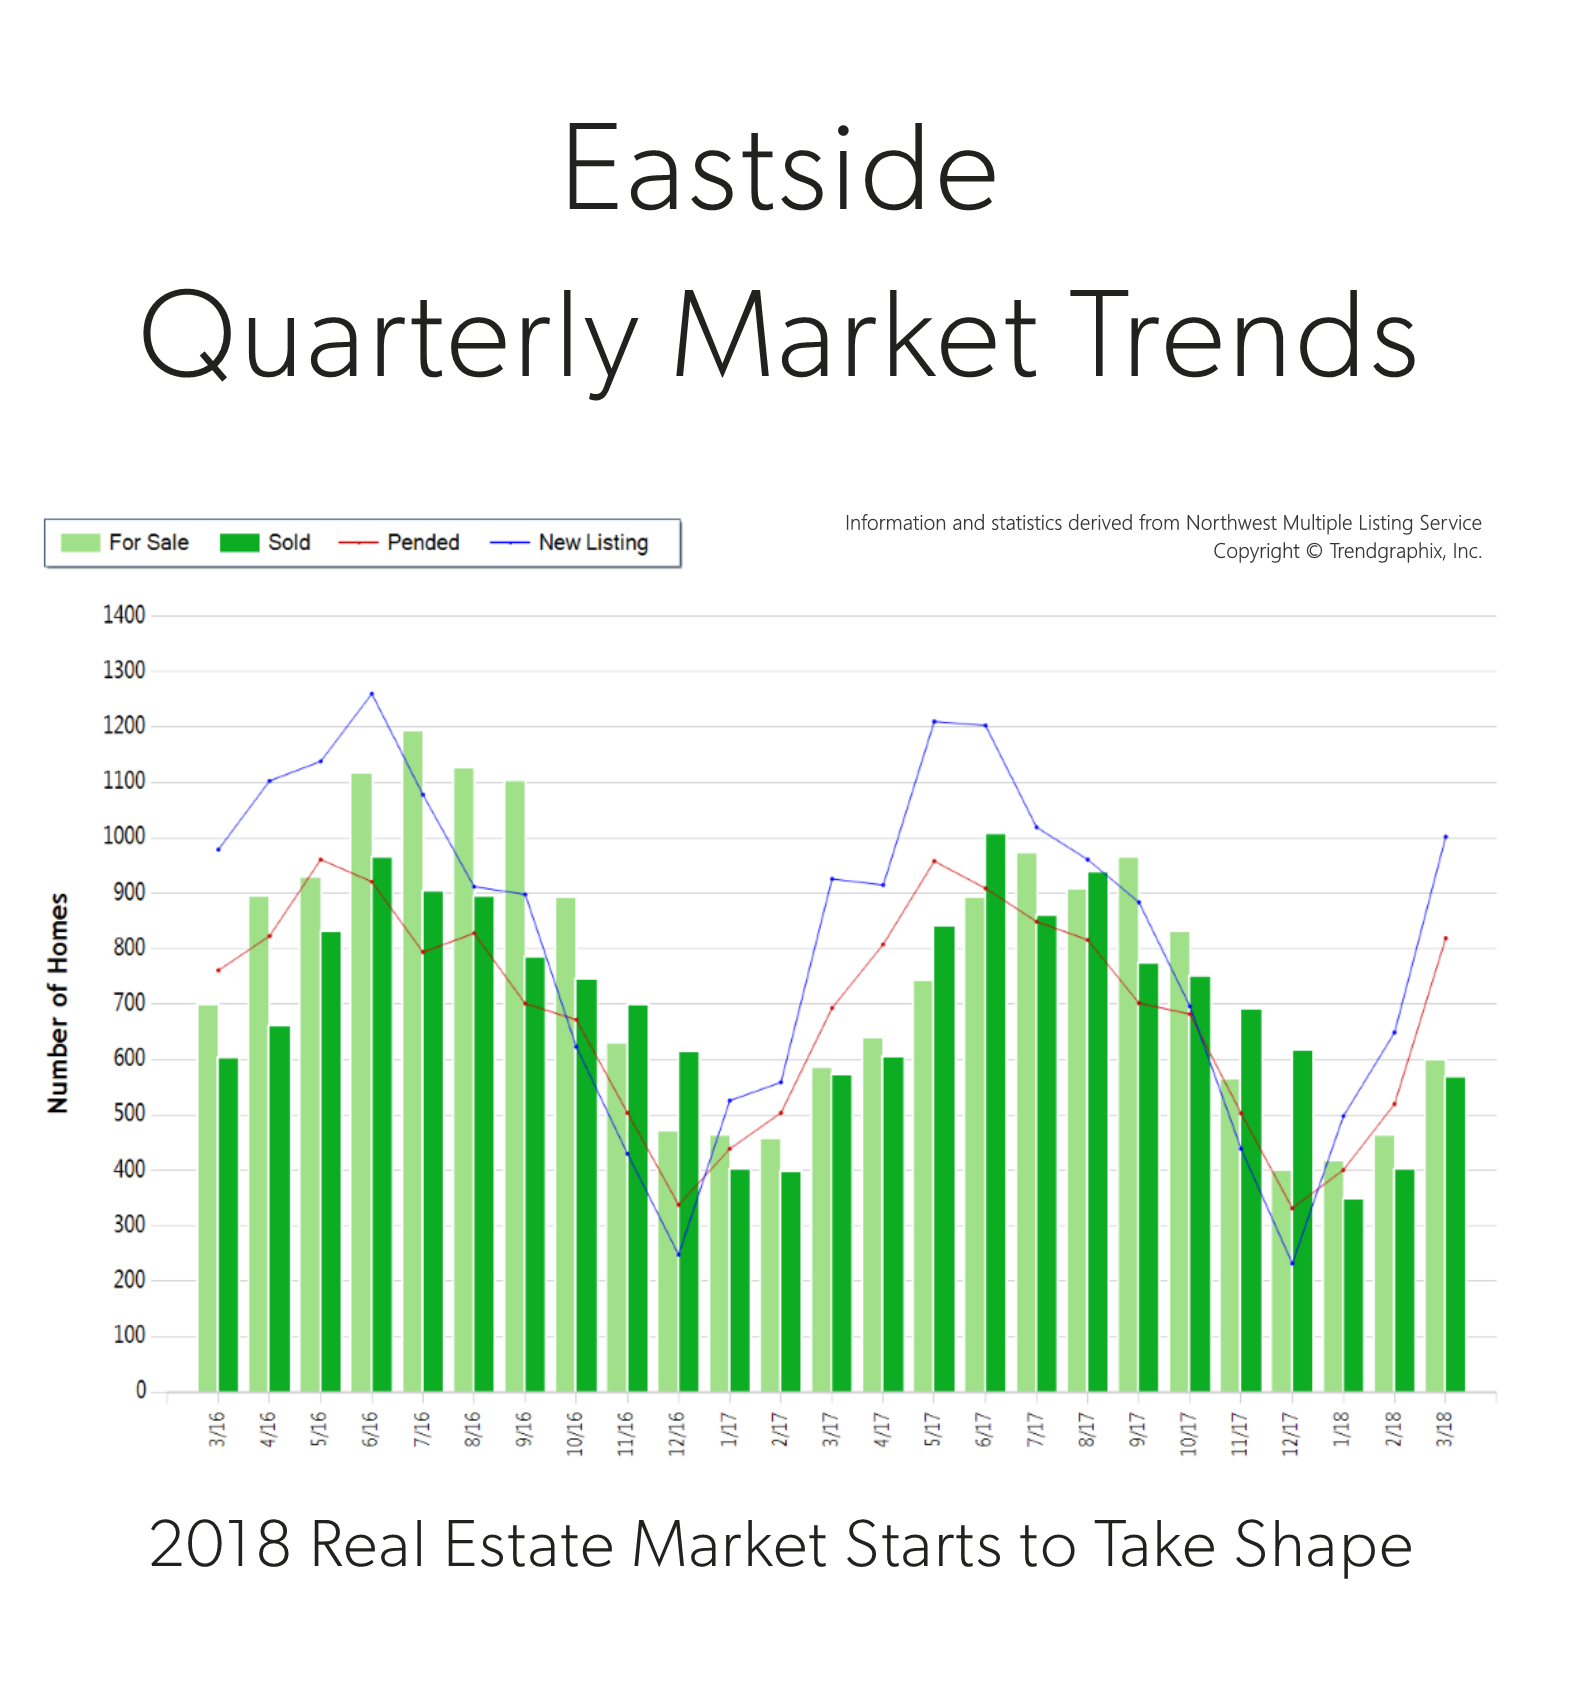
It is the time of year when our market starts to take off. Spring is here and we are starting to see seasonal increases in inventory. In fact, there was a 54% increase in new listings in March compared to February. That increase was topped by a 58% rise in pending sales, illustrating very strong demand for housing in your area. Last month, the average list-to-sale price ratio (the amount the sale price topped the list price) was 103%, indicating that multiple offers were the norm. We ended the quarter with 0.7 months of inventory – the lowest level yet. More inventory would be absorbed by happy buyers looking for more selection and would help temper price growth, which is up 14% year-over-year.
Eastside real estate has a very high premium due to close-in commute times and desirable neighborhoods. In fact, the median price in March was $927,000! Sellers are enjoying amazing returns due to this phenomenon, and buyers are securing mortgages with minor debt service due to low interest rates. This is a very strong seller’s market, but buyers who are securing a home are already enjoying appreciation in equity.
This is only a snapshot of the trends on the Eastside area; please contact me if you would like further explanation of how the latest trends relate to you.
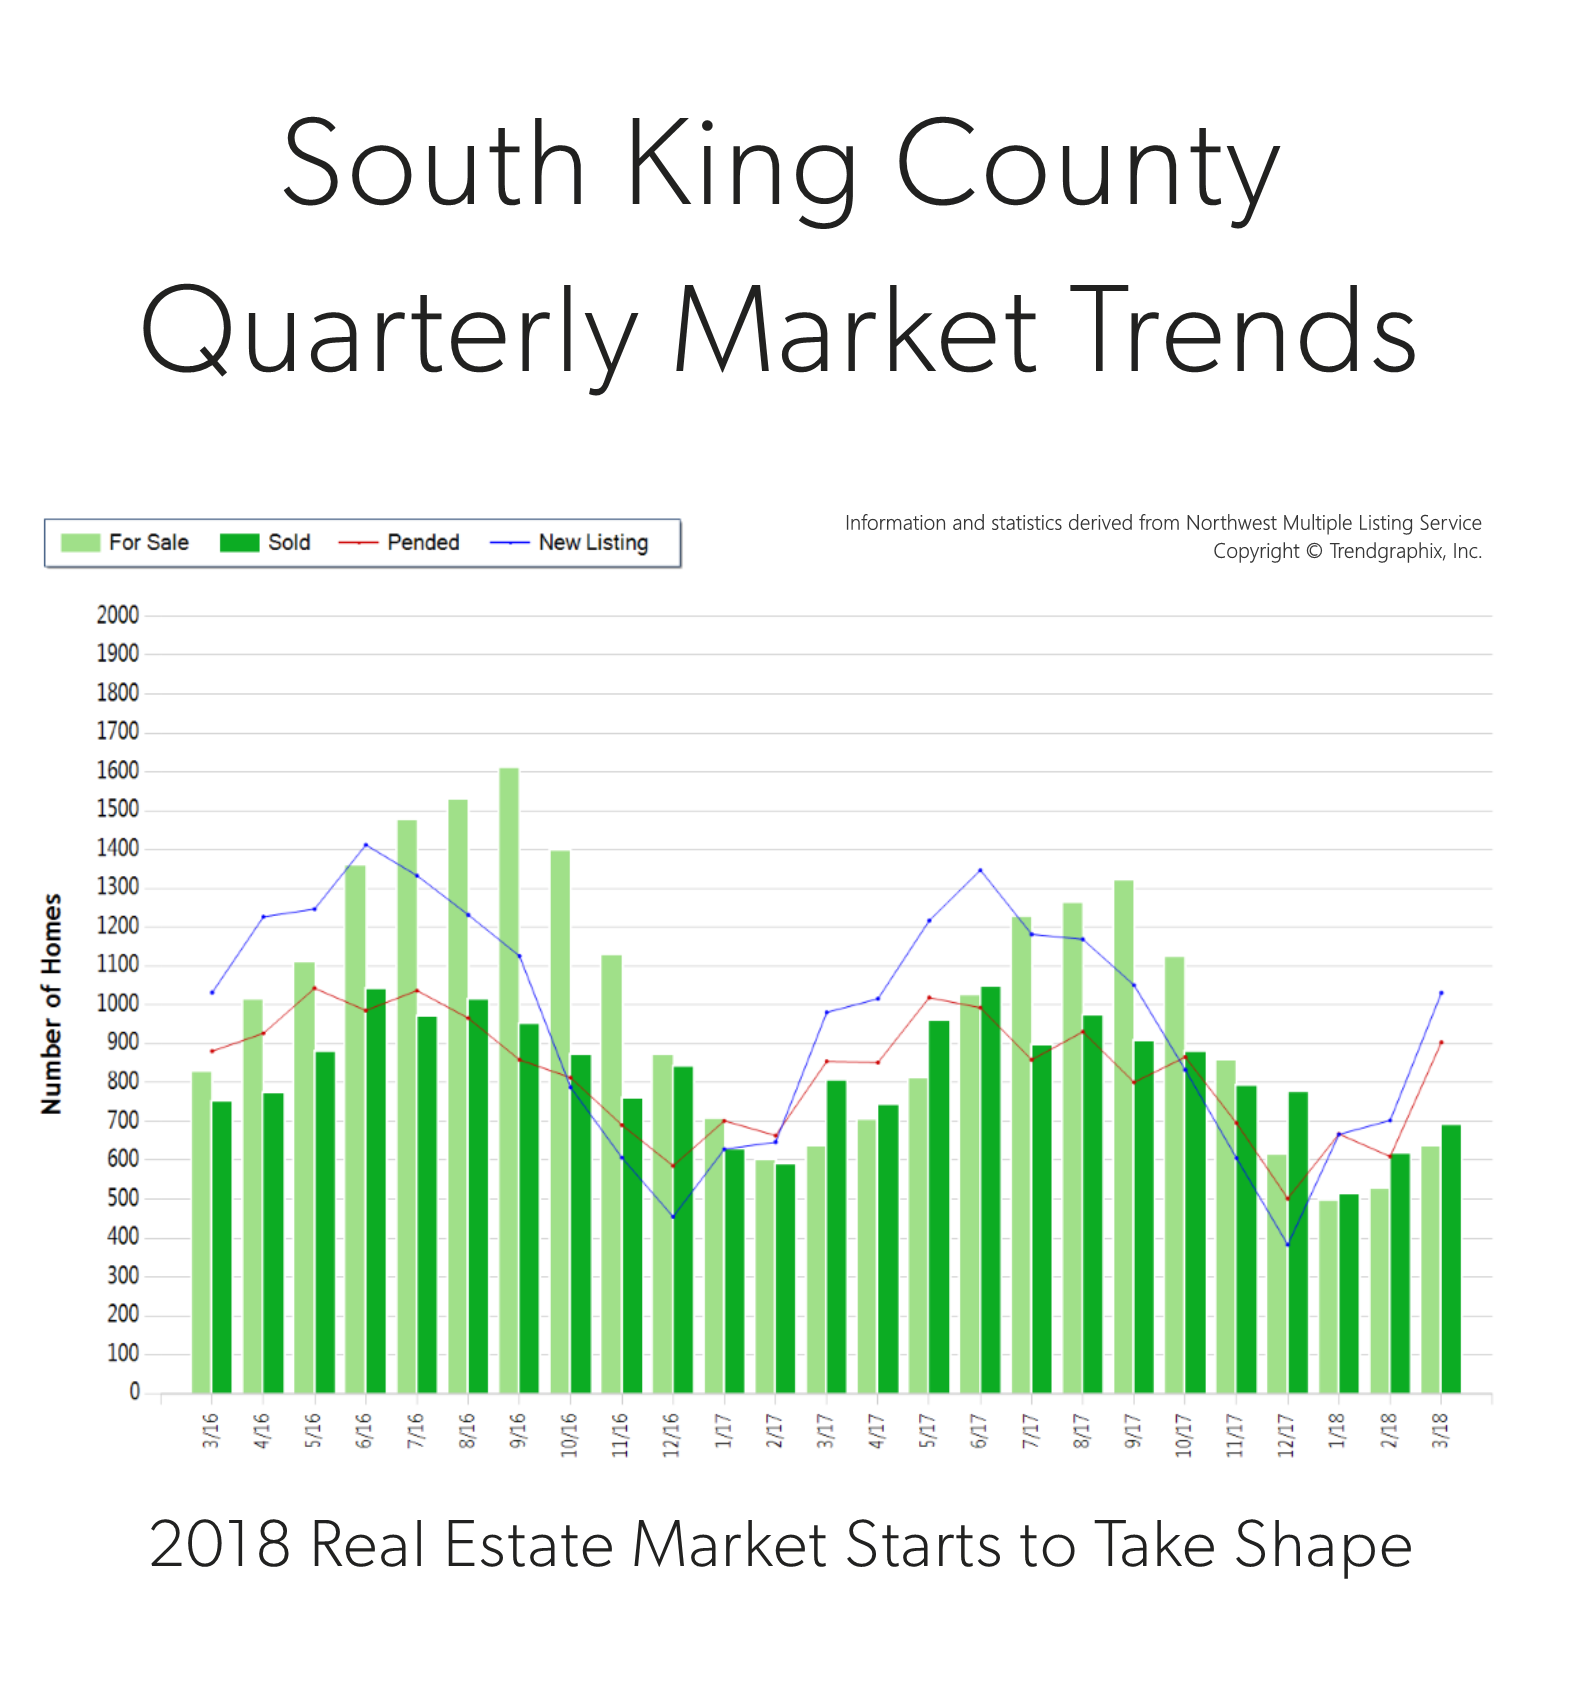
It is the time of year when our market starts to take off. Spring is here and we are starting to see seasonal increases in inventory. In fact, there was a 47% increase in new listings in March compared to February. That increase was matched by a 48% rise in pending sales, illustrating very strong demand for housing in your area. Last month, the average list-to-sale price ratio (the amount the sale price topped the list price) was 101%, indicating that multiple offers were the norm. We ended the quarter with 0.7 months of inventory – the lowest level yet. More inventory would be absorbed by happy buyers looking for more selection and would help temper price growth, which is up 12% year-over-year.
South King County real estate has been a hot spot due to reasonable commute times and overall affordability compared to “in-city” real estate. In fact, the median price in March was 78% higher in Seattle Metro. Sellers are enjoying amazing returns due to this phenomenon, and buyers are securing mortgages with minor debt service due to low interest rates. This is a very strong seller’s market, but buyers who are securing a home are already enjoying appreciation in equity.
This is only a snapshot of the trends in south King County; please contact me if you would like further explanation of how the latest trends relate to you.
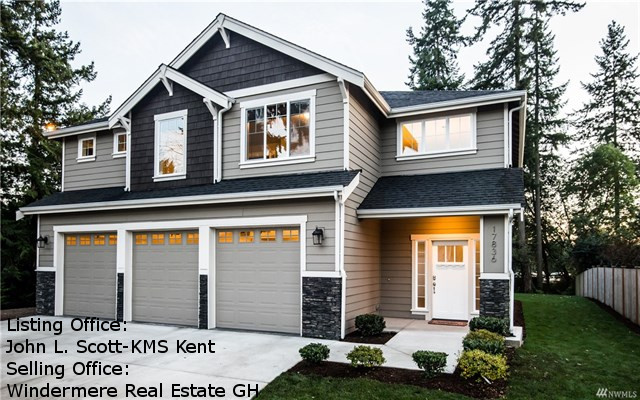
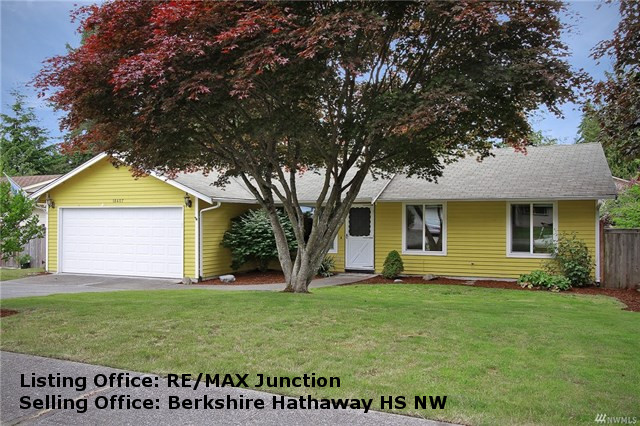
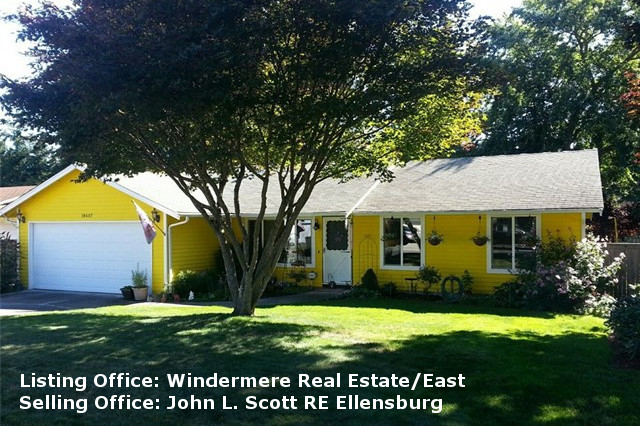
Since 2014, home values have grown by over 10% each year, resulting in a resounding 35% or more return in pricing. Above are some examples of actual homes sold in late 2017 to early 2018 that also sold in 2014, and that were not remodeled or significantly improved in between sales. These examples show the growth in home values that we have experienced over the last three years due to our thriving local economy. I pulled these examples to show you actual pound-for-pound market data versus the statistical percentages I often quote in these market updates. I thought these examples were pretty telling and quite exciting.
This phenomenon has been driven by a lack of available housing inventory and super high demand due to the robust job market in our area influenced by companies like Amazon. In 2017, there were 1,000 people moving into our area each week! According to census data, that trend is supposed to continue.
The large price gains might seem familiar to the gains of the previous up market of 2004-2007 that resulted in a bubble, but this environment is much different, which is why we are not headed toward a housing collapse. Previous lending practices allowed people to get into homes with risky debt-to-income ratios, low credit scores, and undocumented incomes. A large part of why the housing bubble burst 10 years ago was due to people getting into mortgages they were not equipped to handle, which lend to the eventual fall of sub-prime lending and the bubble bursting. Matthew Gardner, Windermere’s Chief Economist speaks to this topic in this video.
It is supply and demand that is creating these huge gains in prices. An increase in inventory would be healthy and would temper price growth. Many folks who have been waiting for their current home values to return in order to make big moves involving their retirement, upgrading homes, investing, or even buying a second home are well poised to enter the market. If you are one of those people, I hope these examples provide insight on the increase in home values and how they might pertain to your goals.
Potential buyers might shy away from the market due to affordability. While it is expensive to buy a home in the Greater Seattle area, the people that have become homeowners over the last three years have built some amazing wealth. Interest rates remain low, helping to absorb the cost of a home in our area. Last month, I wrote a Love Letter to Buyers which helped layout the advantages of participating in today’s market and how to be successful. If you or any one you know is considering making a purchase, it is worth the read.
As we head into the active spring and summer months, if you’d like me to provide you a complimentary Comparable Market Analysis (CMA) on your home, so you have a better understanding of your home’s value, I’d be happy to do that. This would be an important component in charting your 2018 financial goals, and what a great time of year to gather that information! It is my goal to help keep my clients informed and empower strong decisions.
Celebrate Earth Day with us! Bring all your sensitive documents to be professionally destroyed on-site by Confidential Data Disposal. Limit 20 file boxes per customer.
We will also be collecting non-perishable food and cash donations to benefit Concern for Neighbors Food Bank. Donations are not required, but are appreciated.
*This is a shredding-only event. Only paper will be accepted – no electronics or recyclables.
Spring Gardening Tips to Help Get Your Yard Flourish-Ready
It is approaching that time of year when April showers will start to bring May flowers, so no better time to get outside to start prepping the garden. First, one must get their hands dirty cleaning out the beds, tending the soil and trimming back plants to prepare for new plantings and fresh growth. For a complete list of Spring gardening tips, click here.

 Facebook
 X
X
 Pinterest
 Copy Link