Facebook
 X
X
 Pinterest
 Copy Link
 Most recently, buyers have enjoyed more selection in the marketplace which has led to more open negotiations versus bidding wars. This is illustrated by an increase in average Days on Market and a decrease in the average Sold-to-List Price Ratios complete-year over year (the last 12 months over the previous 12 months). In King County, the average Days on Market increased from 22 days to 36 days complete-year over year, and the Sold-to-List Price Ratio decreased from 101% to 98%. In Snohomish County, the average Days on Market increased from 25 to 35 days complete-year over year, and the Sold-to-List Price Ratio decreased from 100% to 98%.
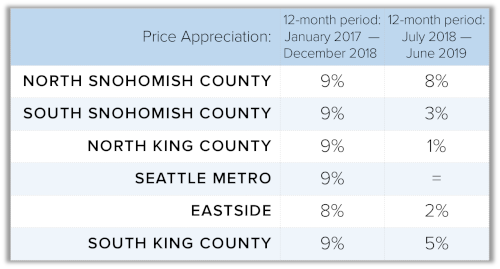
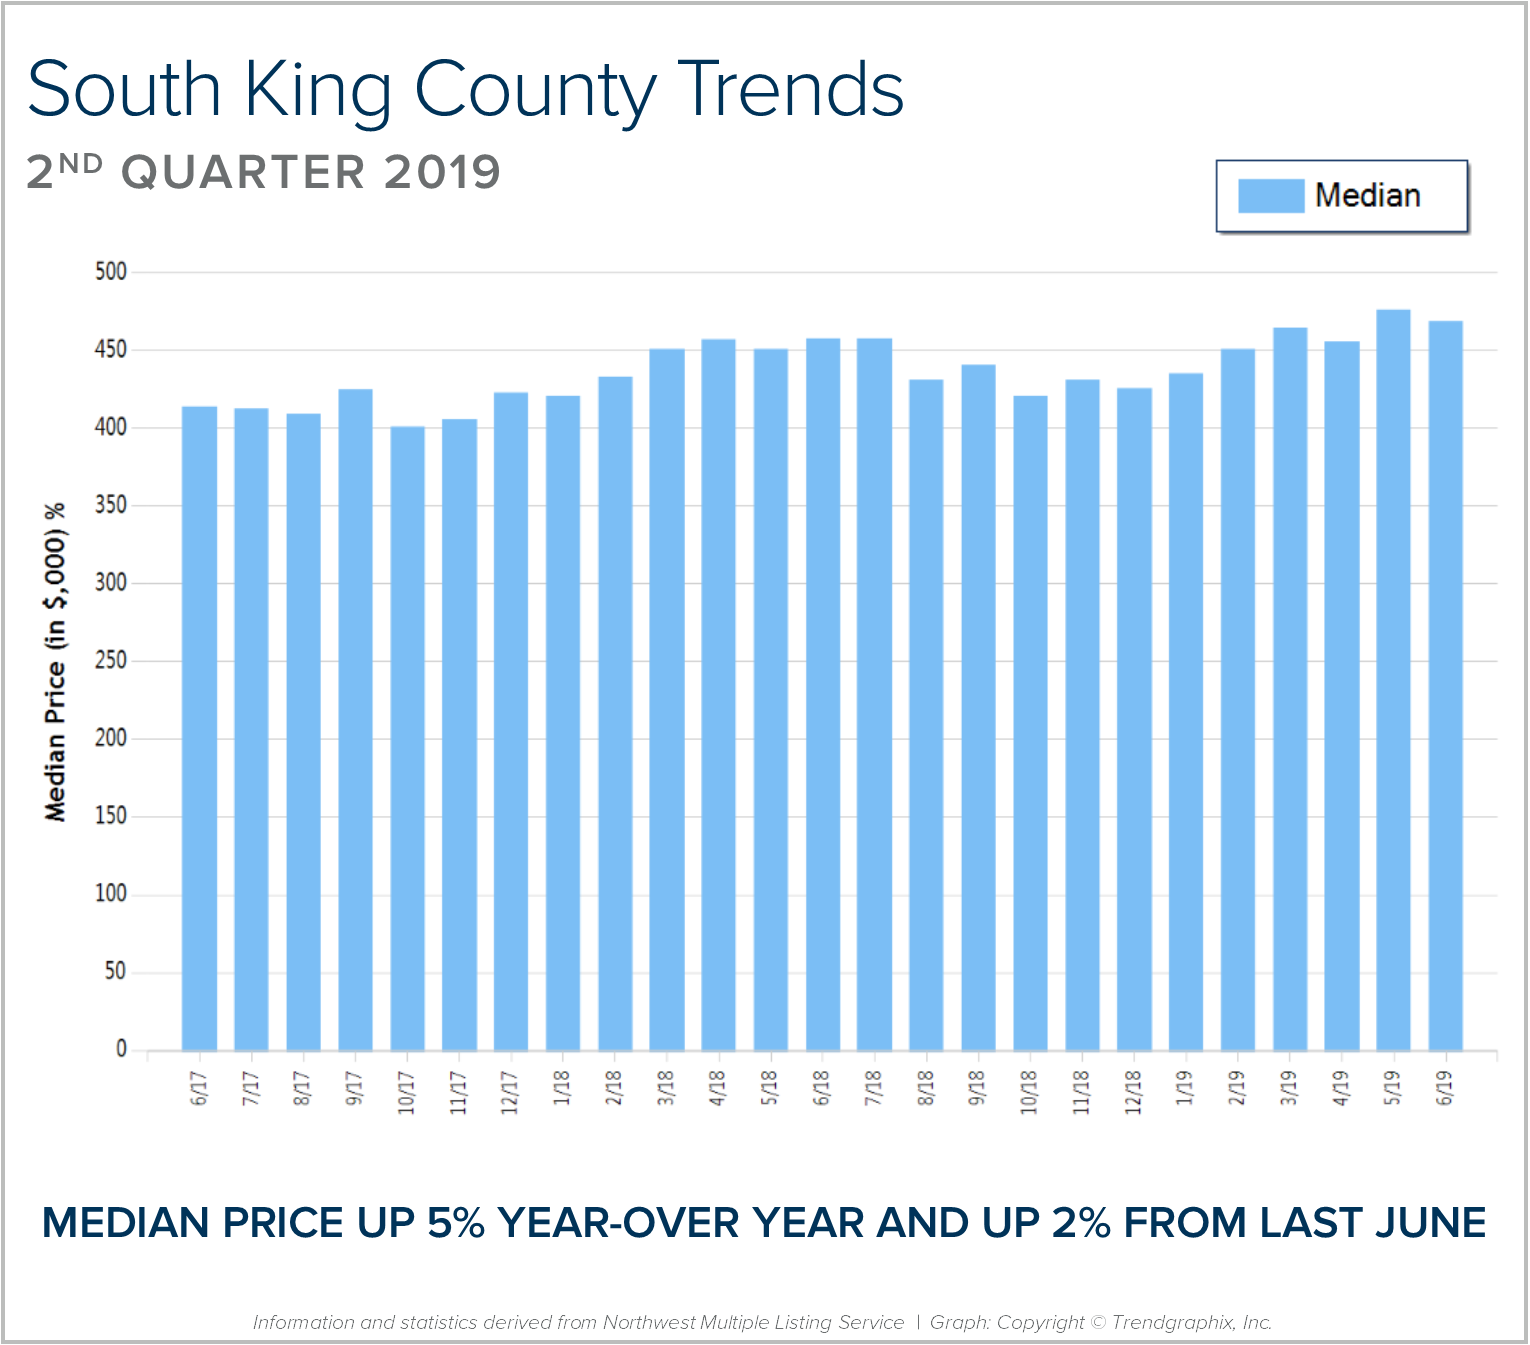
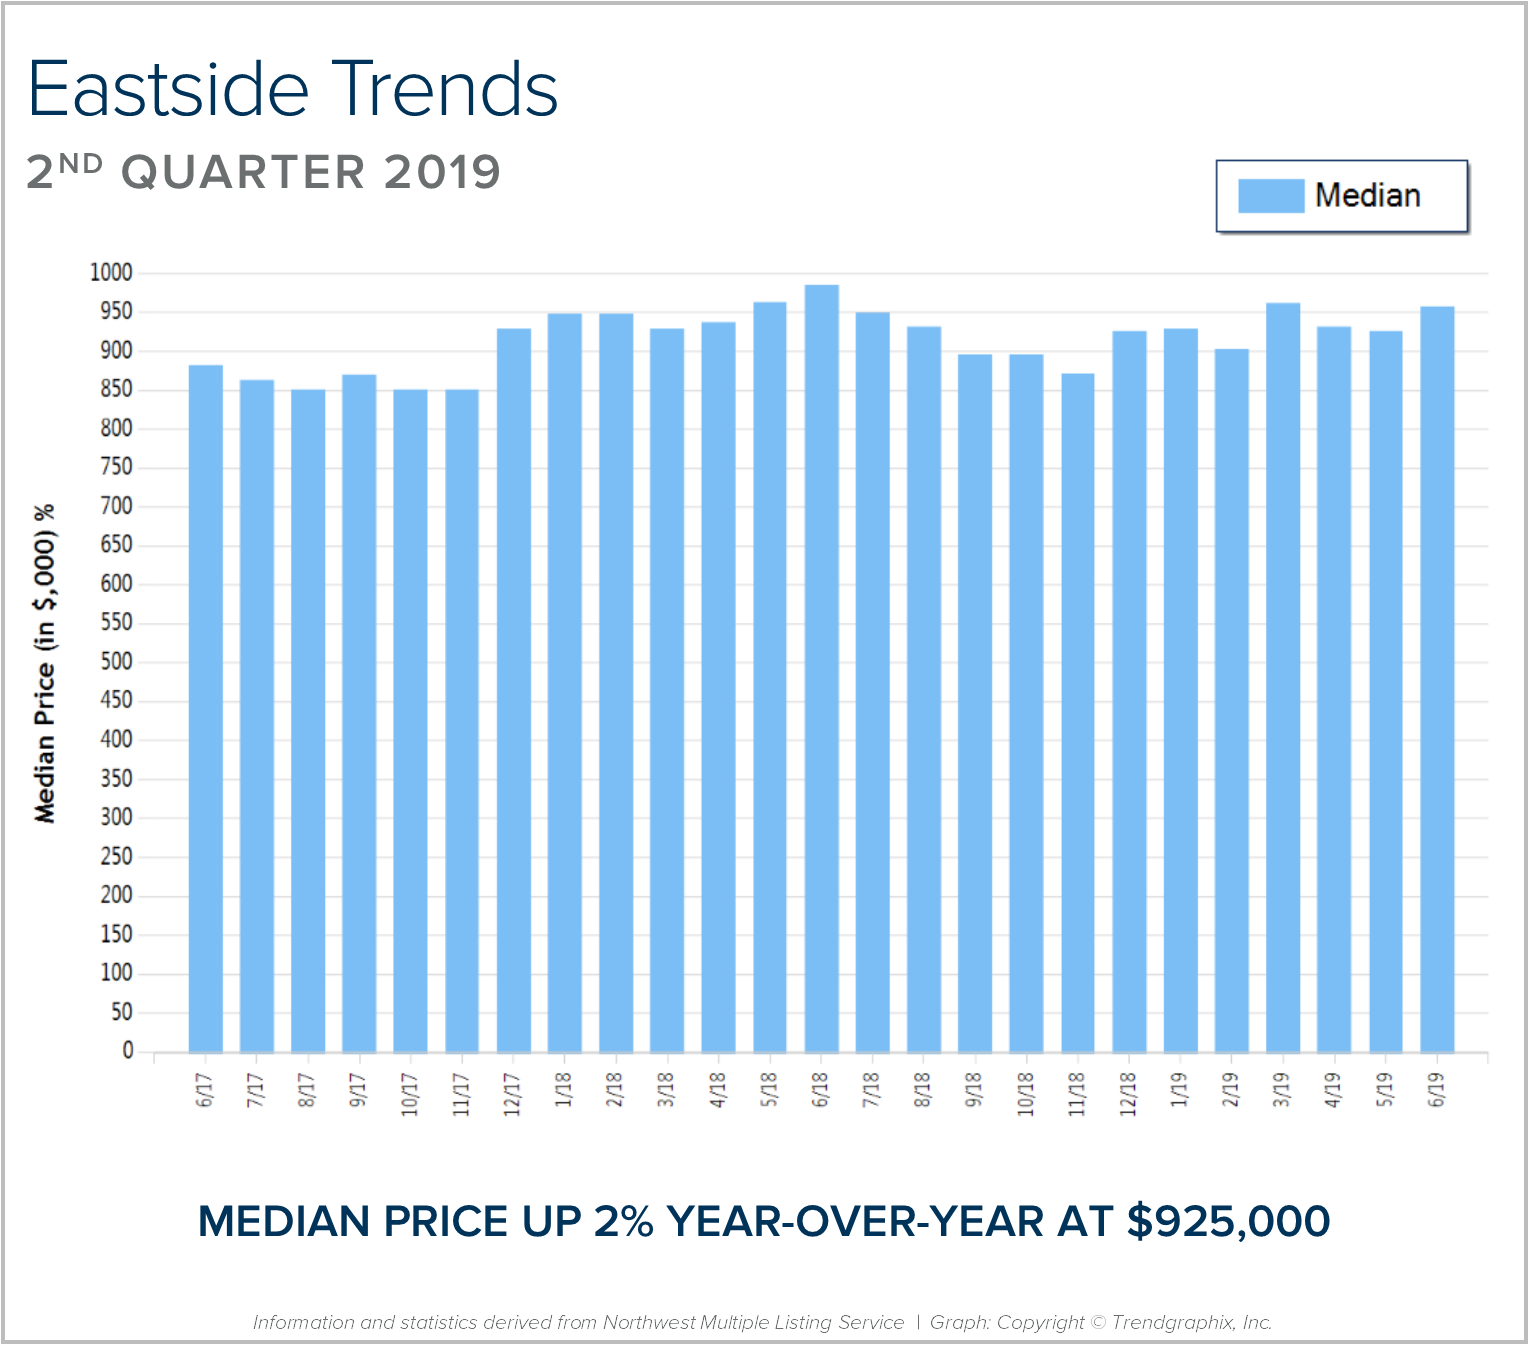
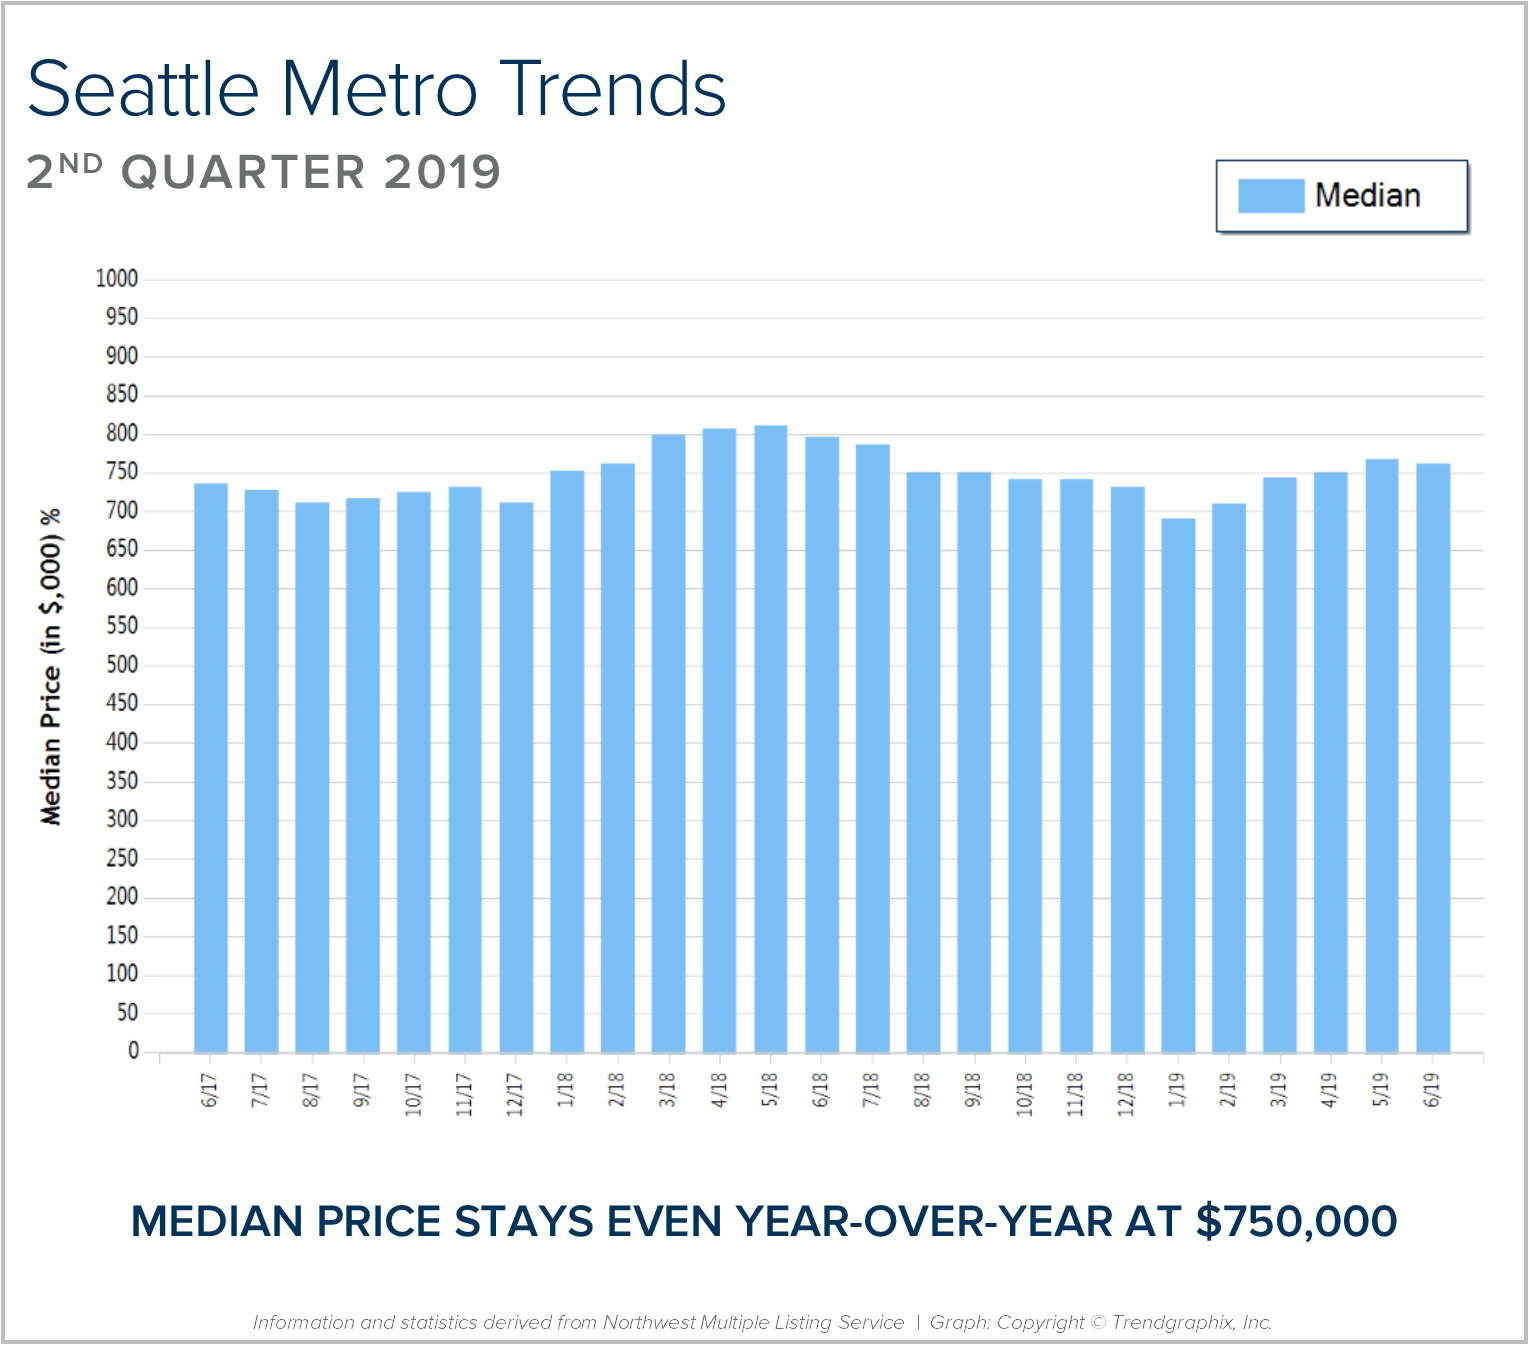
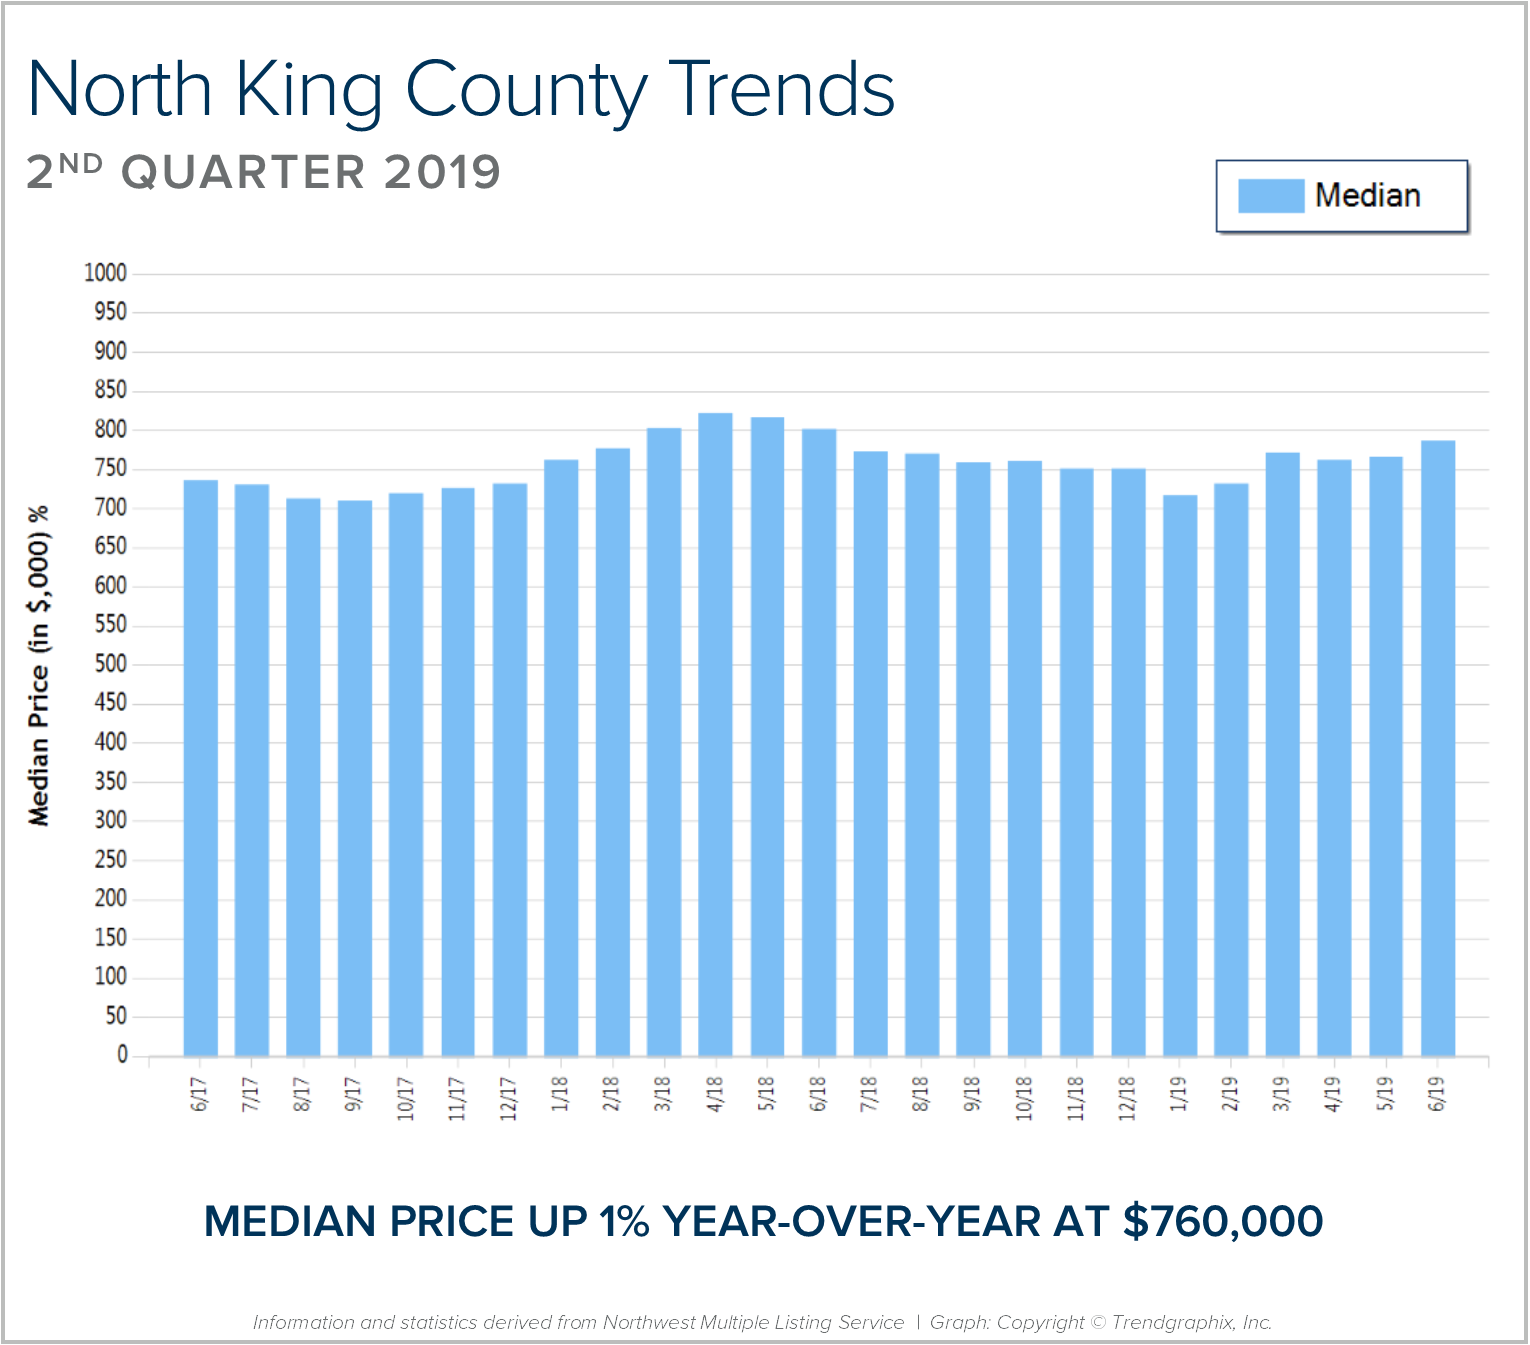
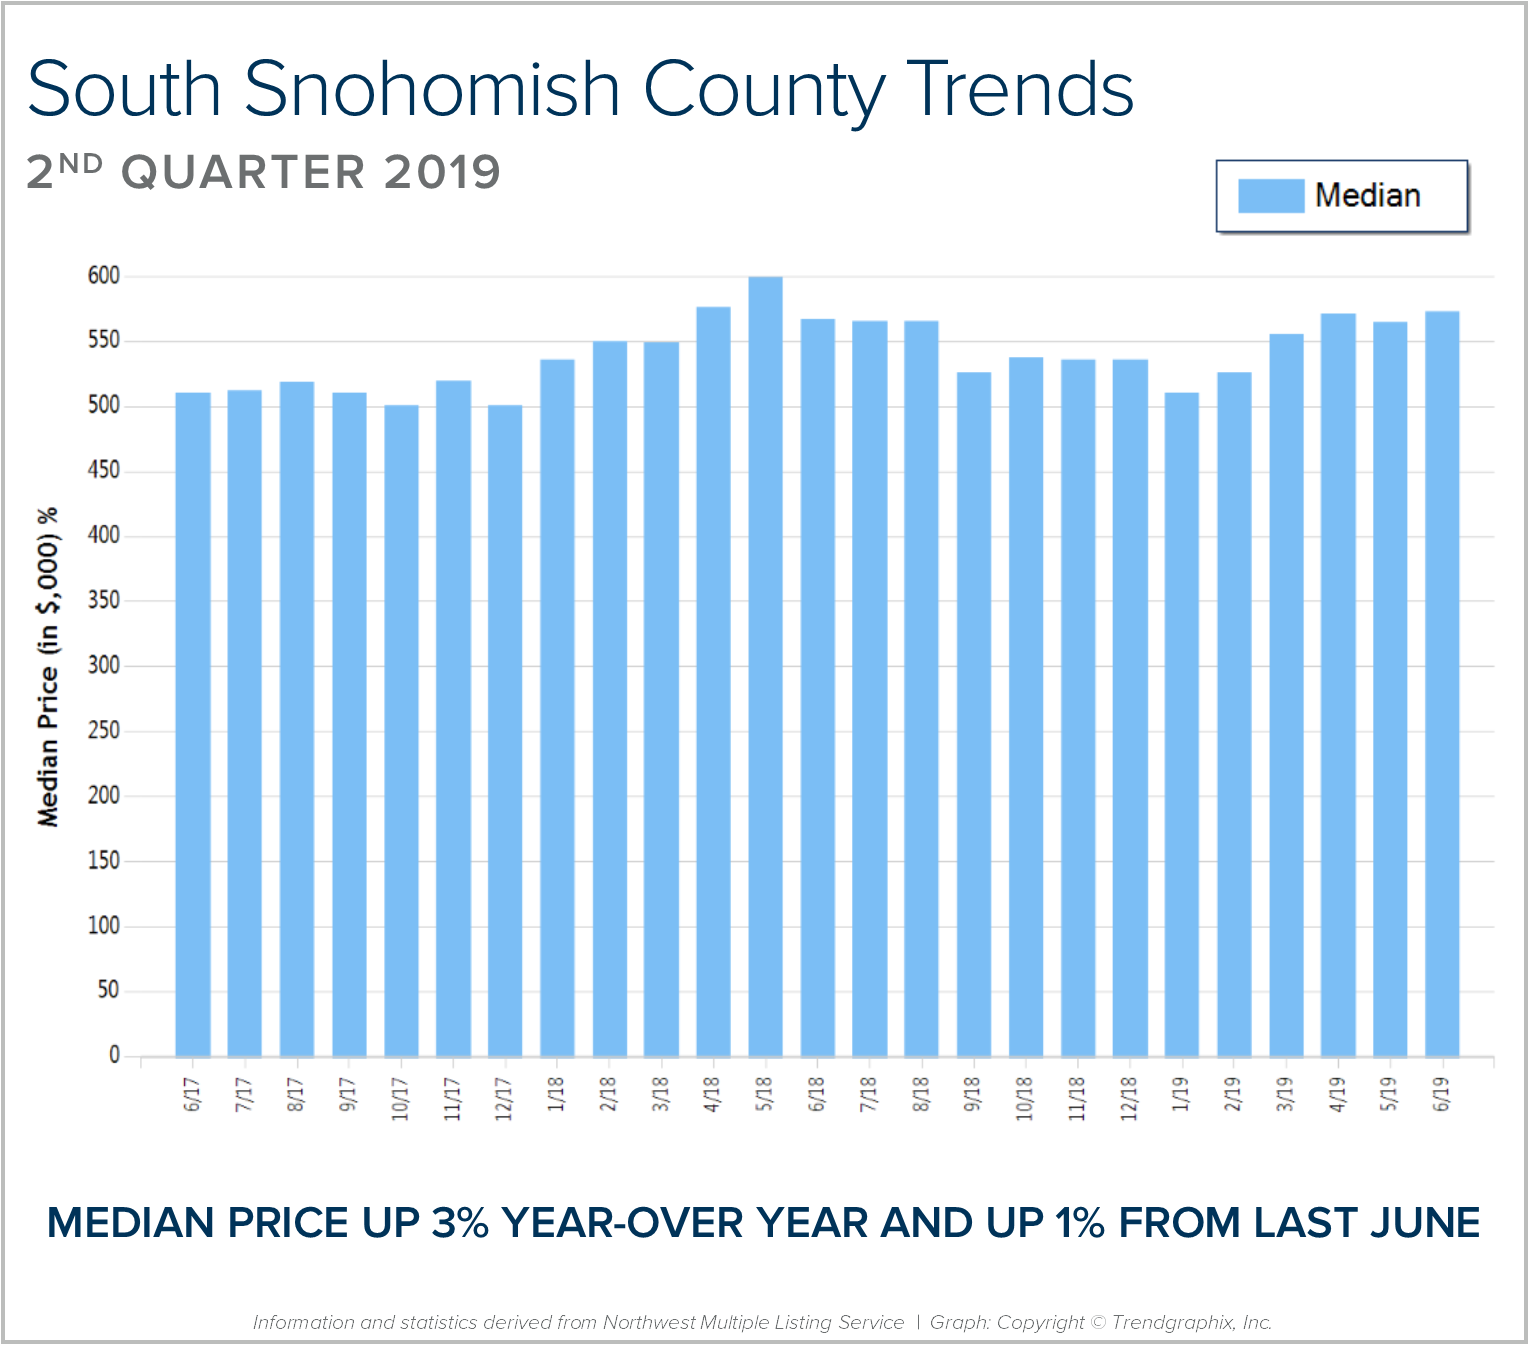
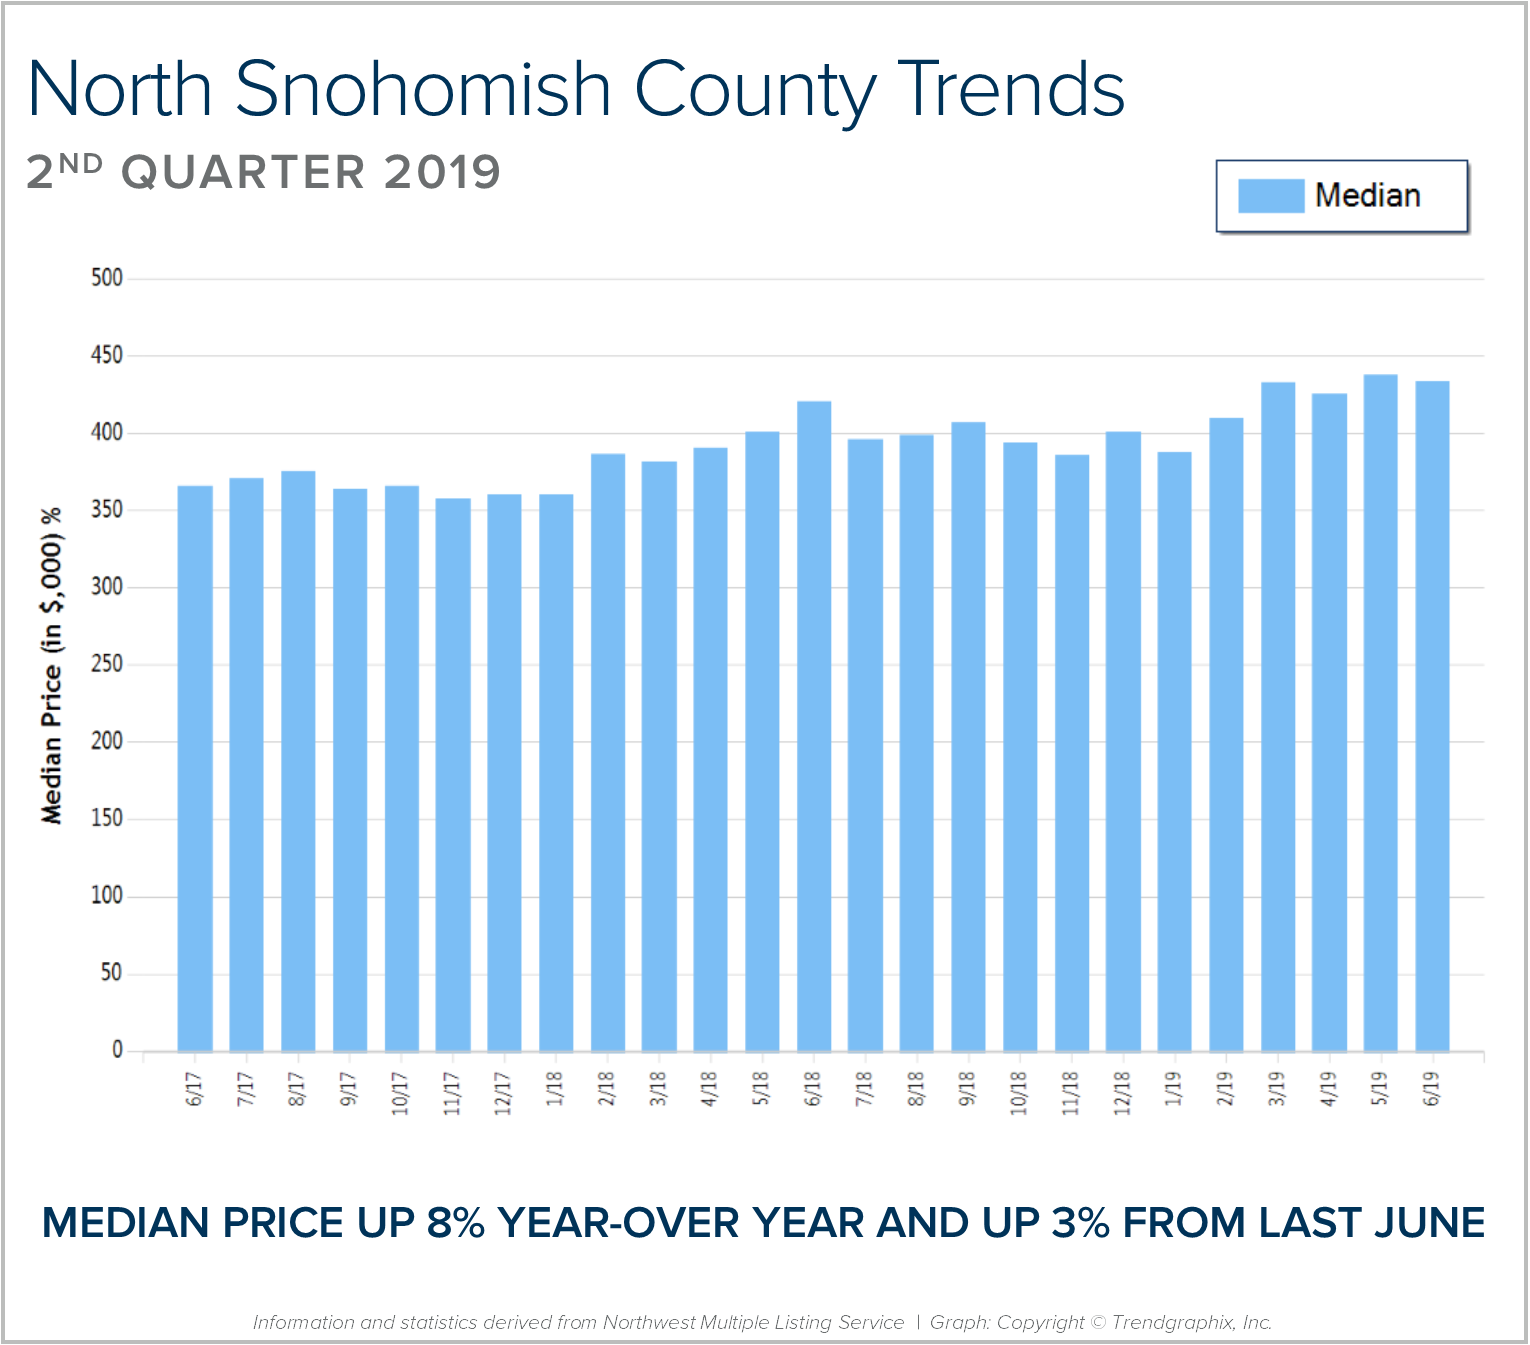
Buyers have had more selection to choose from which has tempered price growth complete-year over year. Median price remains even in King County and up 3% in Snohomish County. Multiple offers are not as commonplace as they were, but terms such as inspection contingencies and home sale contingencies are doable in some areas and price ranges. This balancing out has created some more normal terms for buyers, while sellers are getting close to full price on average and cashing out on the above-average appreciation we enjoyed from 2012 to 2018.
It is still a seller’s market, yet we are heading towards balance. The months of available inventory based on pending sales (the amount of time it would take to sell out of homes if no new homes came to market) currently sits at 1.7 months in King County and 1.5 months in Snohomish County. Zero to 3 months is a seller’s market, 3-6 months a balanced market, and 6+ months a buyer’s market. In 2017 to early 2018, inventory levels were commonly under one month, which was a very volatile and constricted environment within which to purchase a home. The direction towards balance is welcome and providing much more comfort when making a move.
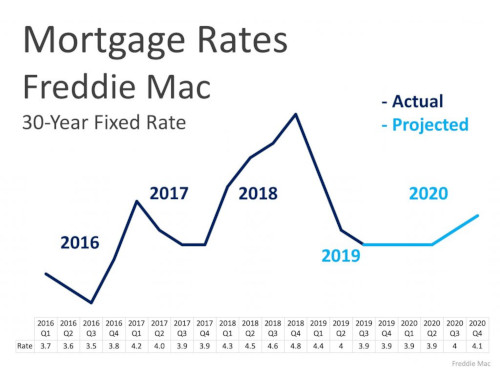
The inventory levels are an amazingly beneficial phenomenon due to the fact that buyers are simultaneously enjoying the lowest interest rates we’ve had since 2016! Currently, the 30-year mortgage rate is hovering around 3.6% and the 15-year around 3.07% according to Freddie Mac. Not only are rates the lowest we’ve seen in 3 years, but they are an entire point lower than they were a in Q4 of 2018. When rates crested 4.5% last year, we saw a marked reduction in pending sales. This highlights the recent opportunities that have come alive for buyers to secure such low debt service and for sellers to have a larger audience. When rates rise, folks reassess and sometimes step aside, which is why this current opportunity should be taken advantage of.
CREATOR: gd-jpeg v1.0 (using IJG JPEG v62), quality = 82
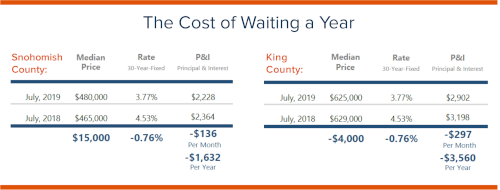
This is meaningful because the rule of thumb is that for every one-point decrease in interest rate, a buyer gains ten percent in purchase power. For example, if a buyer is shopping for a $500,000 home and the rate decreases by a point during their search, they can up their price ceiling to $550,000 and keep the same monthly payment. This is huge, especially in the wake of intense price growth over the last 6-7 years, which priced many buyers out of the market. Buyers that took a break and stepped to the sidelines in the past may want to consider their opportunities now. This is the most favorable buyer environment (inside of a seller’s market) we’ve seen in some time!
This recent decrease in rate is helping the move-up market come alive. What is great about this, is that it opens up inventory for the first-time buyer and helps complete the market cycle. First-time buyers are abundant right now as the Millennial generation is gaining in age and making big life transitions such as buying real estate. According to Nerd Wallet, 49% of all Millennials have a home purchase in their 5-year plan. The rates are also providing very low debt service for investors, second-home buyers, and down-size buyers headed toward retirement.
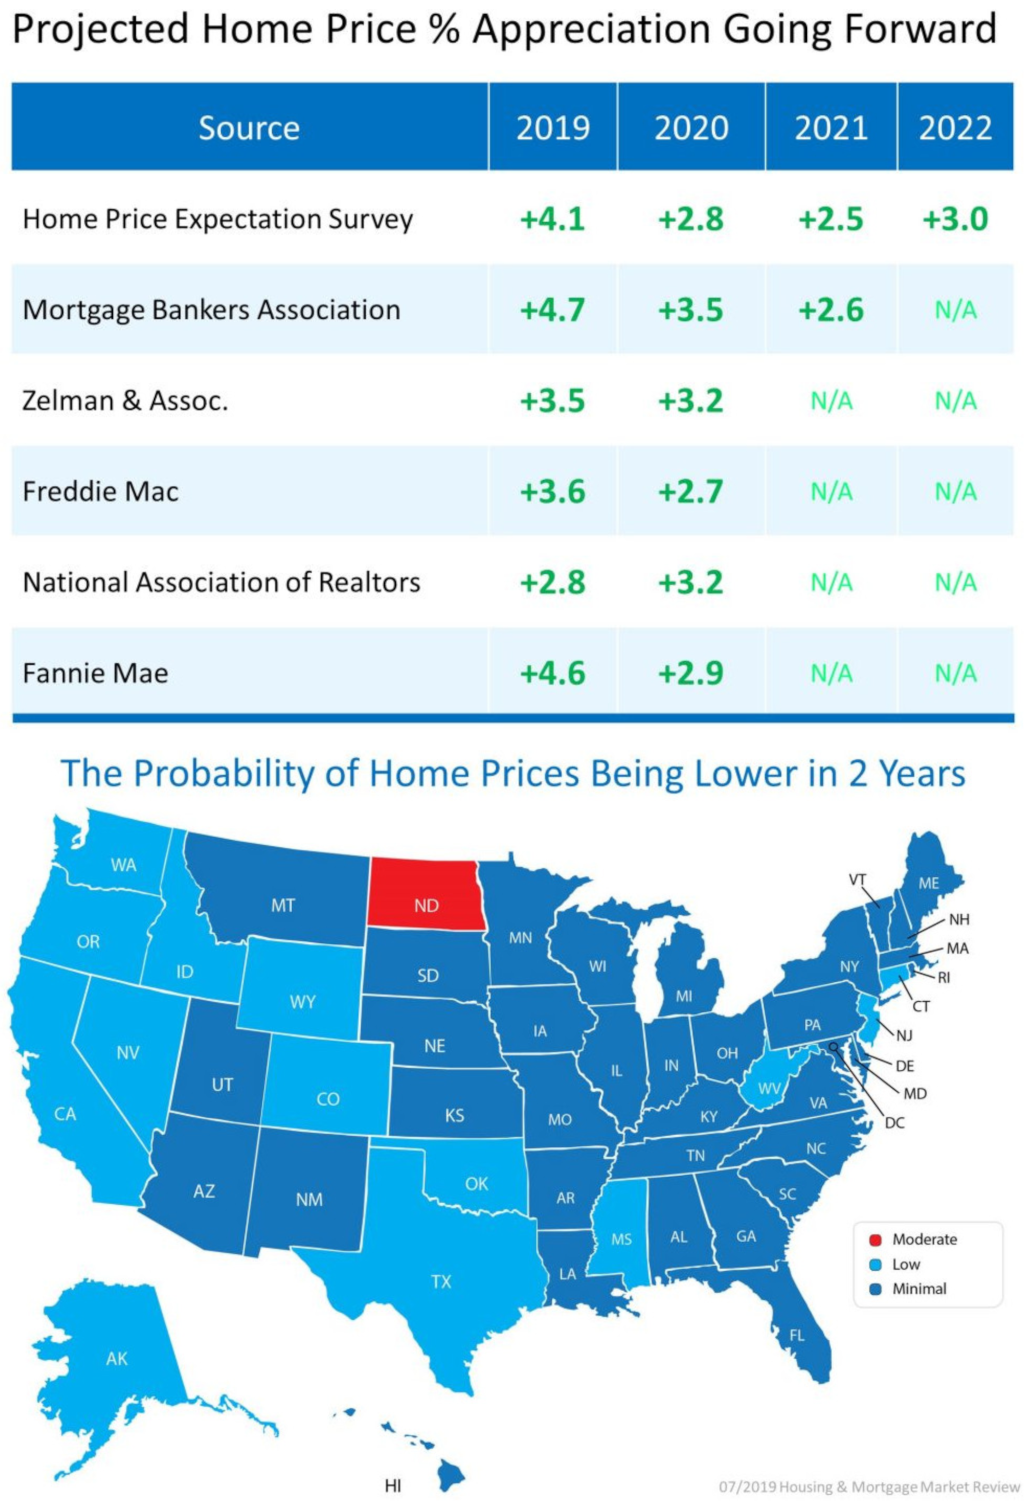
Will these rates last forever? Simply put, no! According to Freddie Mac, rates should increase closer to the 4’s as we round out 2019 and head into 2020. While still staying well below the 30-year average of 6.85%, increases are increases, and securing today’s rate could be hugely beneficial from a cost-saving perspective. Just like the 1980’s when folks were securing mortgages at 18%, the people that lock down on a rate from today will be telling these stories to their grandchildren. Note the 30-year average – it is reasonable to think that higher rates must be in our future at some point.
So what does this mean for you? If you have considered making a move, or even your first purchase, today’s rates are a huge advantage in helping make a move more affordable. If you are a seller, bear in mind that today’s interest rate market is creating strong buyer demand, providing a healthy buyer pool for your home. As a homeowner who has no intention to make a move, now might be the time to consider a refinance. What is so exciting about these refinances, is that it is not only possible to reduce your monthly payment, but also your term, depending on which rate you would be coming down from.
If you would like additional information on how today’s interest rates pertain to your housing goals, please contact me. I would be happy to educate you on homes that are available, do a market analysis on your current home, and/or put you in touch with a reputable mortgage professional to help you crunch numbers. Real estate success is rooted in being accurately informed, and it is my goal to help empower you to make sound decisions for you and your family.

I am pleased to present the second-quarter 2019 edition of the Gardner Report, which provides insights into select counties of the Western Washington housing market. This analysis is provided by Windermere Real Estate Chief Economist Matthew Gardner. I hope that this information will assist you with making better-informed real estate decisions. For further information about the housing market in your area, please don’t hesitate to contact me.

Summer is quickly coming to a close, and it’s time to think about prepping your yard for fall. Here are a few quick tips to get you started, and a full article here.
Fertilizing
All summer long, plants and grass are using up nutrients in the soil. After months of growing, your soil’s reserves become depleted, which is why a fall fertilizer is great to restore nutrients and give your grass, shrubs, and perennials a boost to help them make it through winter. It is recommended to fertilize once every season.
Stop Pruning and Watering
Late summer and fall might seem like a good time to prune dead flowers and branches, but several experts recommend waiting until spring to prune anything. Pruning stimulates new growth, but with the frost coming, chances are this new growth won’t survive. Pruning also interferes with the plant when it is going dormant.
In late September, you should also stop watering your plants to help them go dormant as well.