
 Facebook
 X
X
 Pinterest
 Copy Link
Q4 2018 – North Snohomish County Quarterly Market Trends
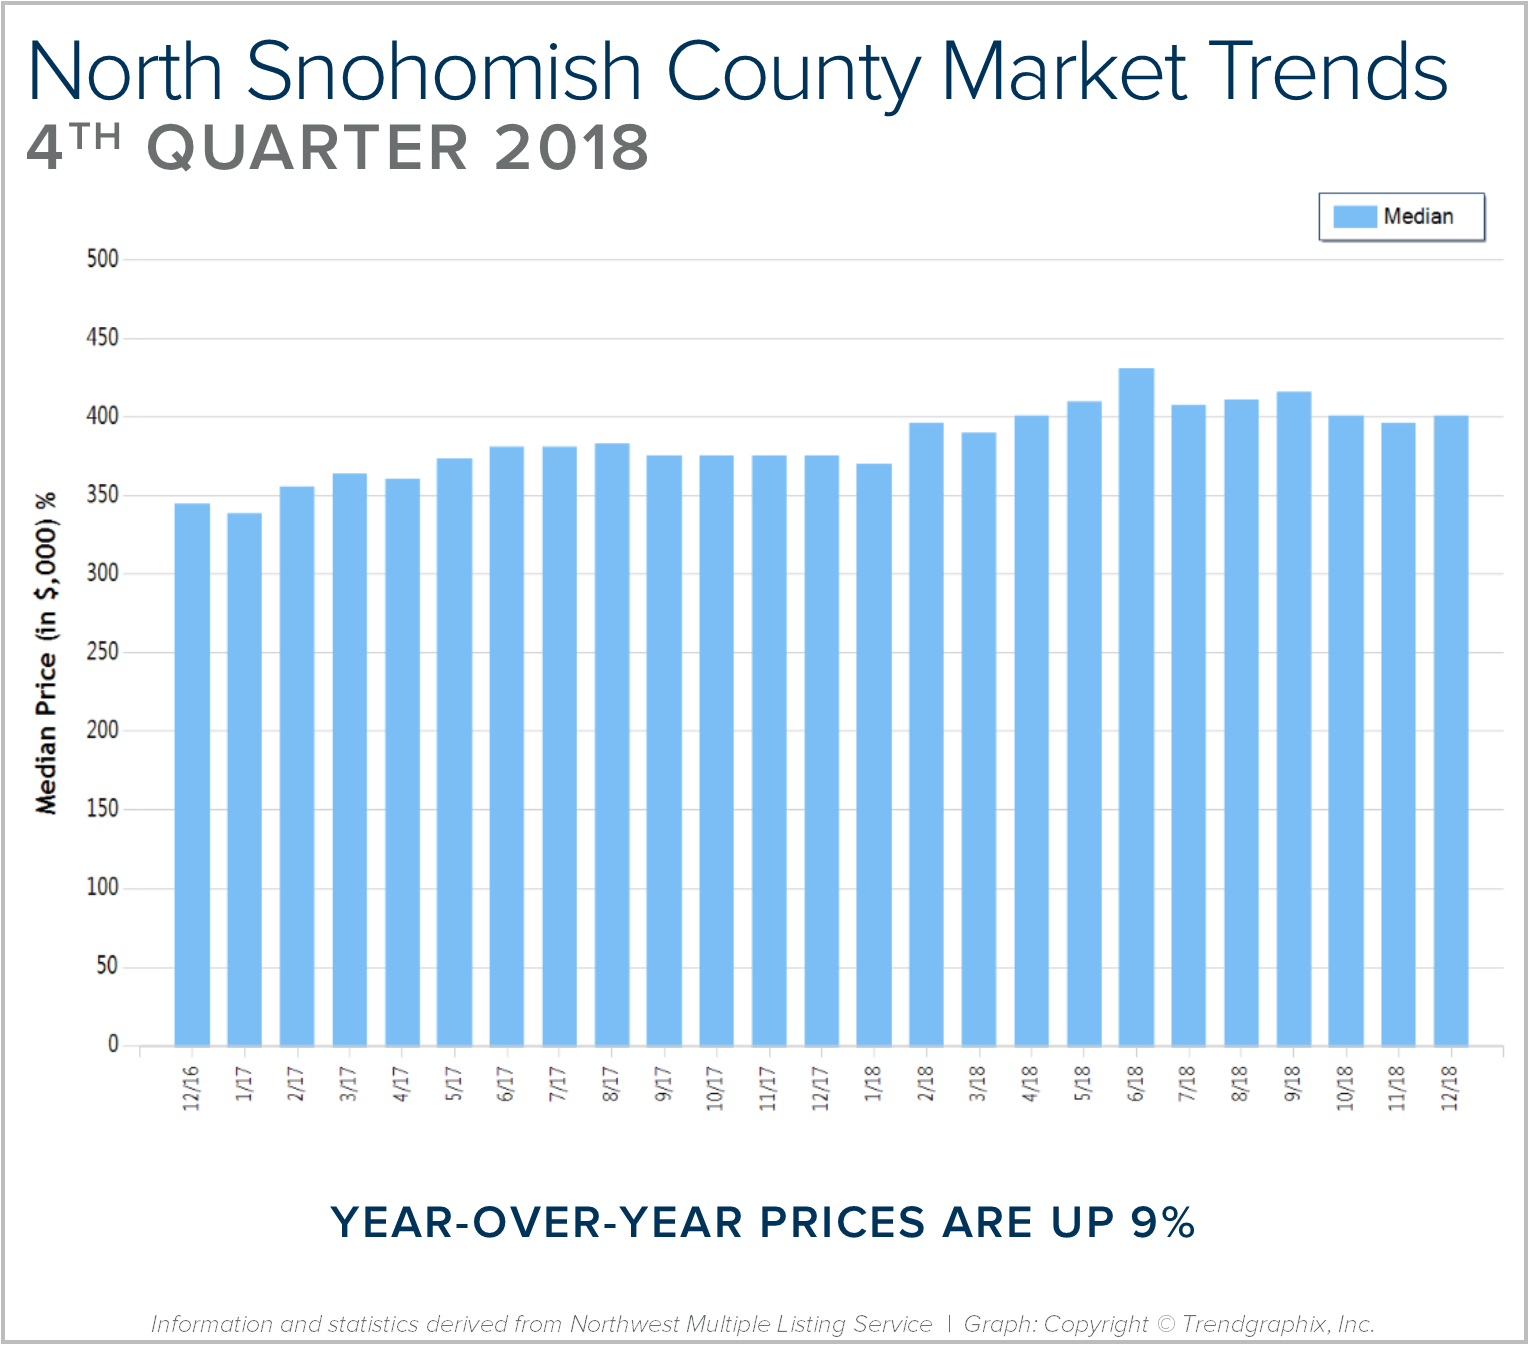
2018 was a year of change and growth. The market shifted from an extreme seller’s market, but still had strong gains. Year-over-year, median price is up 9% and since 2012 has increased 88%! Over the last 19 years, the average year-over-year price increase has been 6%. This puts into perspective the growth we have experienced, resulting in well-established equity levels. In 2018, inventory averaged 1.6 months, higher than 2017. This caused the month-over-month price gains to slow, and we experienced a price correction over the second half of the year. We expect to see more average levels of price appreciation in 2019 as the market continues to balance out.
After six years of expansion resulting in an extreme seller’s market, in 2018 we encountered a market shift in the late spring. Inventory increased, interest rates took a jump, and demand took a step back to re-evaluate the new playing field. This resulted in a tempering of month-over-month price appreciation, and has established some long-awaited balance. This balance has brought opportunities for both buyers and sellers. Buyers have more selection and are negotiating terms like inspection items and concessions. Sellers are sitting on 6+ years of equity growth, and are now able to sell their home and make a move without fearing where they will land next. Interest rates are still well below the 30-year average, currently hovering just under 5%. We are seeing demand start to re-engage now that the new normal has settled in.
This is only a snapshot of the trends in north Snohomish County; please contact me if you would like further explanation of how the latest trends relate to you.
Q4 2018 – South Snohomish County Quarterly Market Trends
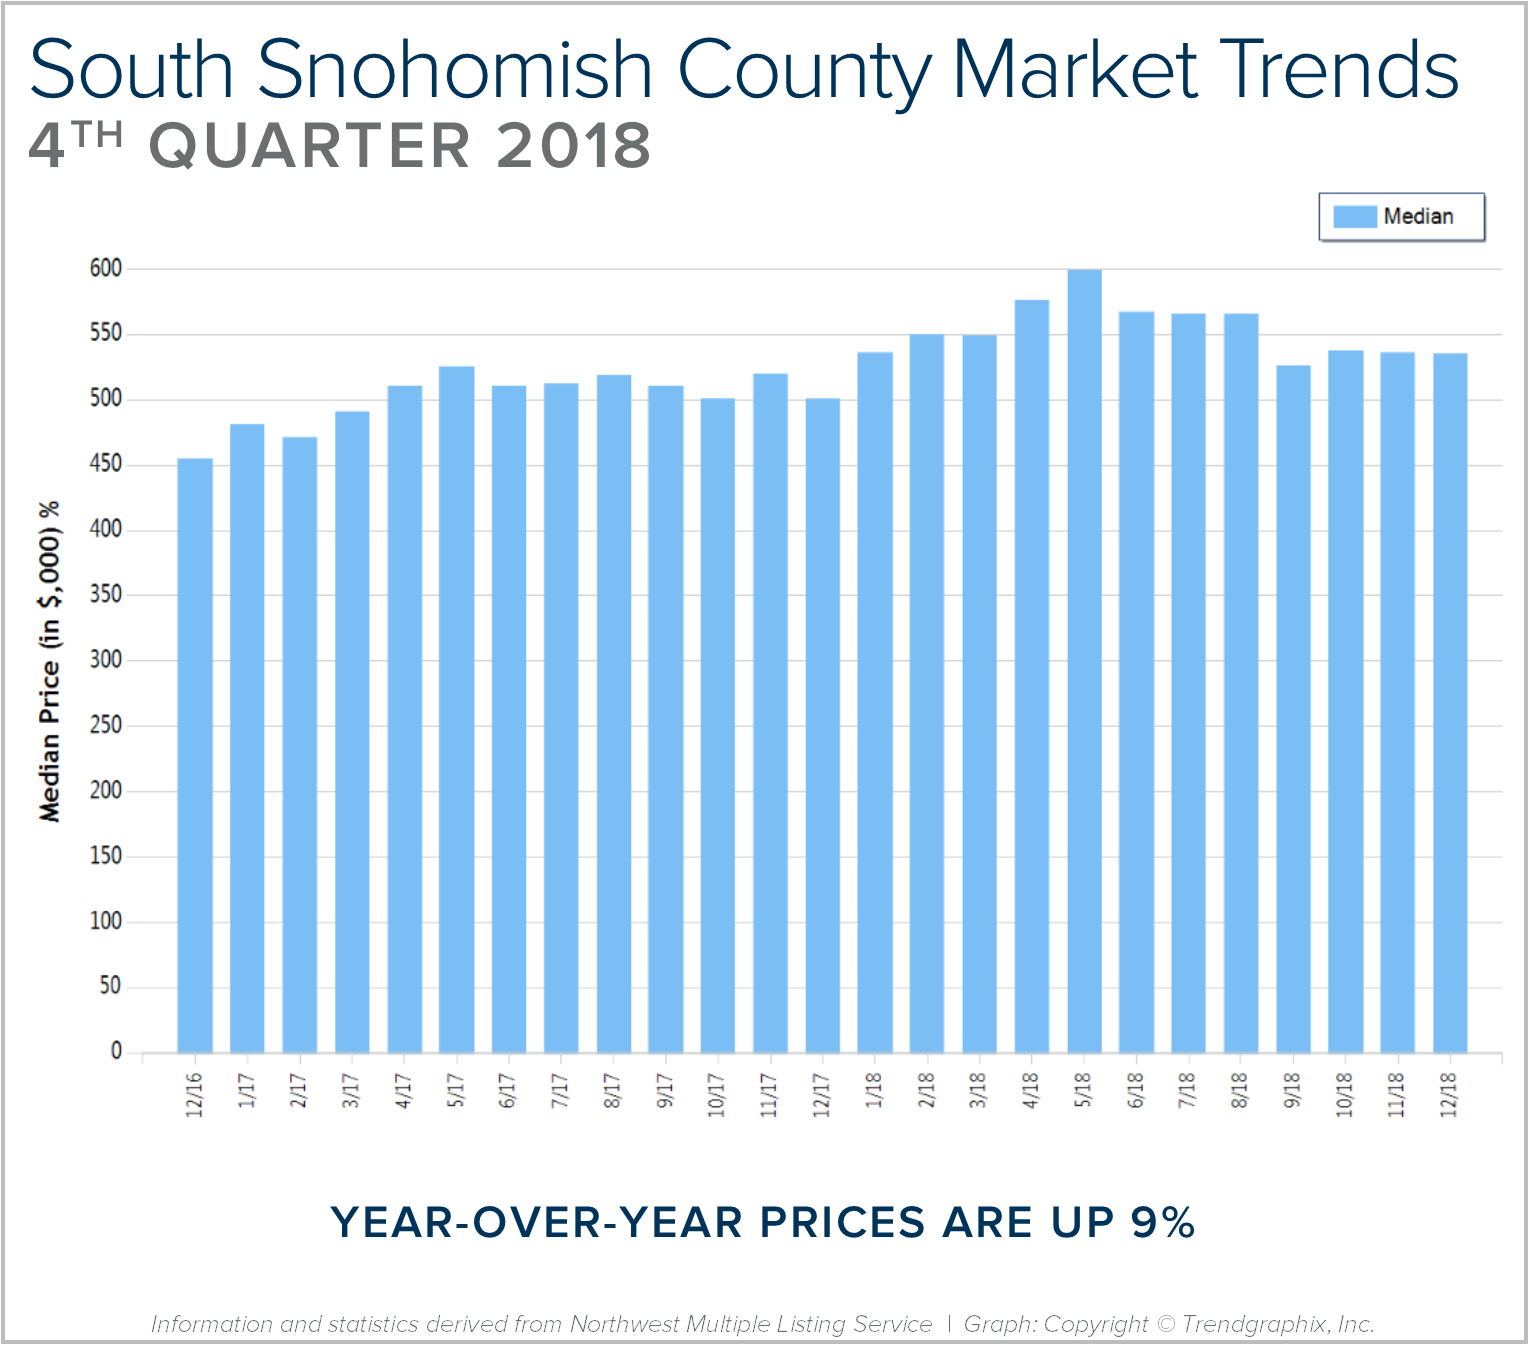
2018 was a year of change and growth. The market shifted from an extreme seller’s market, but still had strong gains. Year-over-year, median price is up 9% and since 2012 has increased 85%! Over the last 19 years, the average year-over-year price increase has been 6%. This puts into perspective the growth we have experienced, resulting in well-established equity levels. In 2018, inventory averaged 1.5 months, double that of 2017. This caused the month-over-month price gains to slow, and we experienced a price correction over the second half of the year. We expect to see more average levels of price appreciation in 2019 as the market continues to balance out.
After six years of expansion resulting in an extreme seller’s market, in 2018 we encountered a market shift in the late spring. Inventory increased, interest rates took a jump, and demand took a step back to re-evaluate the new playing field. This resulted in a tempering of month-over-month price appreciation, and has established some long-awaited balance. This balance has brought opportunities for both buyers and sellers. Buyers have more selection and are negotiating terms like inspection items and concessions. Sellers are sitting on 6+ years of equity growth, and are now able to sell their home and make a move without fearing where they will land next. Interest rates are still well below the 30-year average, currently hovering just under 5%. We are seeing demand start to re-engage now that the new normal has settled in.
This is only a snapshot of the trends in south Snohomish County; please contact me if you would like further explanation of how the latest trends relate to you.
5 Alternatives to a New Year’s Resolution

The pressure to come up with resolutions and improvements always mounts near the end of the year, but everyone knows that statistically speaking, most of us won’t stick to our New Year’s resolutions much past February. So rather than give in to societal pressure, guilt, and feelings of hopelessness, I propose a shift in perspective this year.
Rather than viewing the New Year as catalyst for sweeping lifestyle and character changes, let’s instead take this opportunity to renew our sense of purpose and determination. Here are five ideas to make some positive changes in a different way this year.
- Express Gratitude
“Gratitude can transform common days into thanksgivings, turn routine jobs into joy, and change ordinary opportunities into blessings.” -William Arthur Ward. You will be amazed at the ways your life will begin to change simply by expressing gratitude regularly. It will help you maintain a fresh perspective day in and day out, and will help to keep stress at bay. Make a list of all the things you are thankful for in your life, big and small. Take some time to really lean in to this list and reflect on each one. Especially focus on why you are thankful for each of those things.
- Create a list of things to look forward to
This goes hand-in-hand with gratitude. What are you looking forward to this year? A vacation, a family member getting married, a new restaurant opening, a new novel or a new season of your favorite show. By focusing on the good things coming your way, it will be easier to keep a positive and hope-filled attitude.
- Pick a word for the year
Before the year starts, take some time to look at the big picture of the coming year. Find the theme of what you would like to accomplish or focus on and choose a theme word to guide you. This will give you clarity and focus. Maybe your word for the year is Intentional. Simplify. Peace. Discipline. Fun. When you have your theme word for the year, share it on oneword365.com
- Schedule a quarterly retreat
Life happens, and trying to balance work, family, social life, friends, and other commitments often results in very little time for you. Take some time before the new year starts and schedule yourself a quarterly one-day (or weekend!) retreat to focus on YOU. Remember, if you don’t take care of yourself, you won’t be able to take care of anyone else.
- Try a 30-day challenge
A 30-day challenge consists of setting a small goal that can be achieved in 30 days, as well as a small, specific action that you will take each day to achieve that goal. For example:
Declutter: every day for 30 days, choose 3 items to donate, sell, give away or throw away.
Random acts of kindness: every day for 30 days, perform a random act of kindness such as: leaving change in a vending machine; buying the coffee of the person behind you at Starbucks; send a thank you email to a coworker who deserves more recognition. Spreading kindness will always come back to you.
Happy New Year!
Where to Celebrate NYE

New Year’s Eve 2018 is almost upon us, and if you are still looking for something to do, read on! There are lots of options in the greater Seattle area, whether you are looking for the biggest blow-out bash or an earlier, family-friendly event.
There are actually two parties that will converge at midnight for the iconic Seattle fireworks show.
The Armory Stage will host rock band SWAY from 8pm until midnight. And at the International Fountain, you can dance the night away with live electronic music and video projection show (starts at 10pm). Tickets are required for both parties, however the big fireworks show is free to enjoy.
The Pacific Science Center transforms on NYE with fire sculptures, drinks and live music. There will be special entertainment throughout the night, as well as the standard Science Center exhibits. At midnight, head outside for the Space Needle fireworks. Purchase tickets in advance.
Watch the Seattle Center fireworks from under the glass of Chihuly Gardens. The evening includes appetizers, desserts, live music and a midnight toast. Purchase tickets in advance.
Another Seattle Center option, the Museum of Popular Culture offers four 21+ parties in one. With live music on three performance stages, comedians, party favors, special VIP areas, more than 20 bars, and a special singles-only cocktail hour, this is one of the largest parties of the year. Museum access is included in the price of the party, purchase tickets in advance.
- Tacoma’s First Night
First Night is an all-ages, family-friendly celebration in Downtown Tacoma’s Theater District. The affordable admission price includes museums, music, art, drama, dance, and a whole day and night of activities. The cost of entry increases as the festival gets closer, so buy early to save!
The perfect NYE celebration if you have older kids, this pajama party features comedians, balloon makers, pizza, snacks, and educational, hands-on activities throughout the night. The fun culminates at 9pm with a ball drop.
- New Year’s Eve with Ivar’s Salmon House
Ivar’s on Northlake will host live music, tasty food and view of the fireworks without the crowds. Advanced reservations are required, and will range in price depending on your selections.
Ring in the new year with the latest in R&B, Old School, Jazz and Hip Hop music. This is a 21+, semi-formal event, and hotel packages are available with your ticket purchase.
- Resolution New Year’s Eve Party at WAMU Theater
A Seattle tradition for almost a decade, this 18+ party always brings a mixed crowd together for a night of dancing. This is one of the biggest EDM parties of the year.
Celebrate the coming new year all day at KidsQuest! There are activities every hour from 10am to 4pm, including Bubble Wrap Stomp, New Year’s Hats, Storytime, glittery tattoos, and more. Admission is free with membership or museum admission.
Christmas Tree Farms & Winter Activities
King County:
♦ Buttonwood Farm
14500 NE 116th St, Redmond
100% organic you-cut or white-glove delivery service, saws provided, hot chocolate and cookies
♦ Carnation Tree Farm
31523 NE 40th St, Carnation
You-cut trees, pre-cut trees, wreaths, garlands, mistletoe, Santa visits, Christmas decorations, trees baled, saws provided, hay rides
♦ Cedar Falls Tree Farm
15200 Cedar Falls Rd SE, North Bend
You-cut trees, wreaths, trees bagged & tied, saws provided, free hot cider, picnic area, porta-potties
♦ Christmas Creek Tree Farm
15515 468th Ave SE, North Bend
You-cut trees, pre-cut trees, trees baled, refreshments, hay rides, Santa on weekends, picnic areas
♦ Coates Christmas Trees
17225 SE Green Valley Road, Auburn
You-cut trees, pre-cut trees, wreaths, boughs, garlands, mistleto, Santa, trees bagged and tied
♦ Country Tree Farm
18225 116th Ave SE, Renton
You-cut trees, wreaths, holly, refreshments, Santa
♦ Crown Tree Farm
13005 424th Ave SE, North Bend
You-cut trees, pre-cut trees, wreaths and boughs, decorations, saws provided, trees bagged, free tree trimmings
♦ Crystal Creek Tree Farm
23604 SE 192nd St, Maple Valley
You-cut trees, saws provided, trees baled, cider, porta-potties
♦ Enchanted Winds Tree Farm
8021 Issaquah-Hobart Rd, Issaquah
You-cut trees, wreaths, swags, boughs, holly, gifts, decorations, crafts, trees baled, tree stands, hay wagon, trailer rides, fire pit, hot beverages
♦ Hunter Farms Fresh Cut Trees
7744 35th Ave NE, Seattle
Precut trees, mistletoe, holly, wreaths, flocking, restrooms, trees baled, fire retarding
♦ Keith and Scott Tree Farm
42999 SE 120th St, North Bend
You-cut trees, pre-cut trees, wreaths, boughs, trees tied, baled and trimmed, saws provided, bonfires, refreshments, restrooms
♦ McMurtrey’s Red-wood Christmas Tree Farm
13925 Redmond-Woodinville Rd, Redmond
You-cut trees, pre-cut trees, saws provided, wreaths, beverages, restrooms, wagon rides, tree stands
♦ Serres Farm
20306 NE 50th St, Redmond
You-cut trees, pre-cut trees, saws provided, wreaths, free hot chocolate, restrooms
♦ Snow Valley Christmas Tree Farm
17651 W Snoqualmie River Rd NE, Duvall
You-cut trees, pre-cut trees, wreaths, Santa appearances, decorations, free hot beverages, gift shop, porta-potties
Snohomish County:
♦ Bowen Tree Farm
19301 95th Ave NE, Arlington
You-cut trees, wreaths, decorations, free hot cider, gift shop, porta-potties
♦ Farmer Brown’s Tree Farm
12017 109th Ave NE, Arlington
You-cut trees, saws provided, hot beverages, flocking, gift shop, restrooms
♦ Hemstrom Valley Tree Farm
4329 Robe Menzel Road, Granite Falls
You-cut trees, saws provided, winter events, refreshments
♦ Holiday Forest
3125 280th St NW, Stanwood
You-cut trees, wreaths, boughs, saws provided, winter wagon rides, snacks and refreshment stand
♦ Lochsloy Acres
5511 State Route 92, Lake Stevens
You-cut trees, wreaths, boughs, saws provided, free coffee, cider & hot chocolate
♦ Paterson’s Lazy Acres Tree Farm
1315 188th St NE, Arlington
You-cut trees, saws provided, trees baled, wreaths, decorations, refreshments
♦ Pilchuck Secret Valley Christmas Trees
9533 Mose Rd, Arlington
You-cut trees, wreaths, swags, boughs, holly, picnic area, fire pit, hot beverages, restrooms
♦ Stocker Farms
8705 Marsh Rd, Snohomish
You-cut trees, saws provided, warming fire
♦ Wintergreen Tree Farm
13606 S Machias Rd, Snohomish
Precut trees, you choose and you cut trees, wreaths, boughs, garlands, decorations, Christmas festival, bonfires, free hot cider, gift shop, restrooms
Remember to always call the farm before you go to confirm their supply, hours, if they are allowing choose-and-cut or just pre-cut trees, and which attractions or winter activities are available. All of these things can change quickly during the short Christmas season due to weather, demand, and the farmers business conditions!
South King County Market Trends
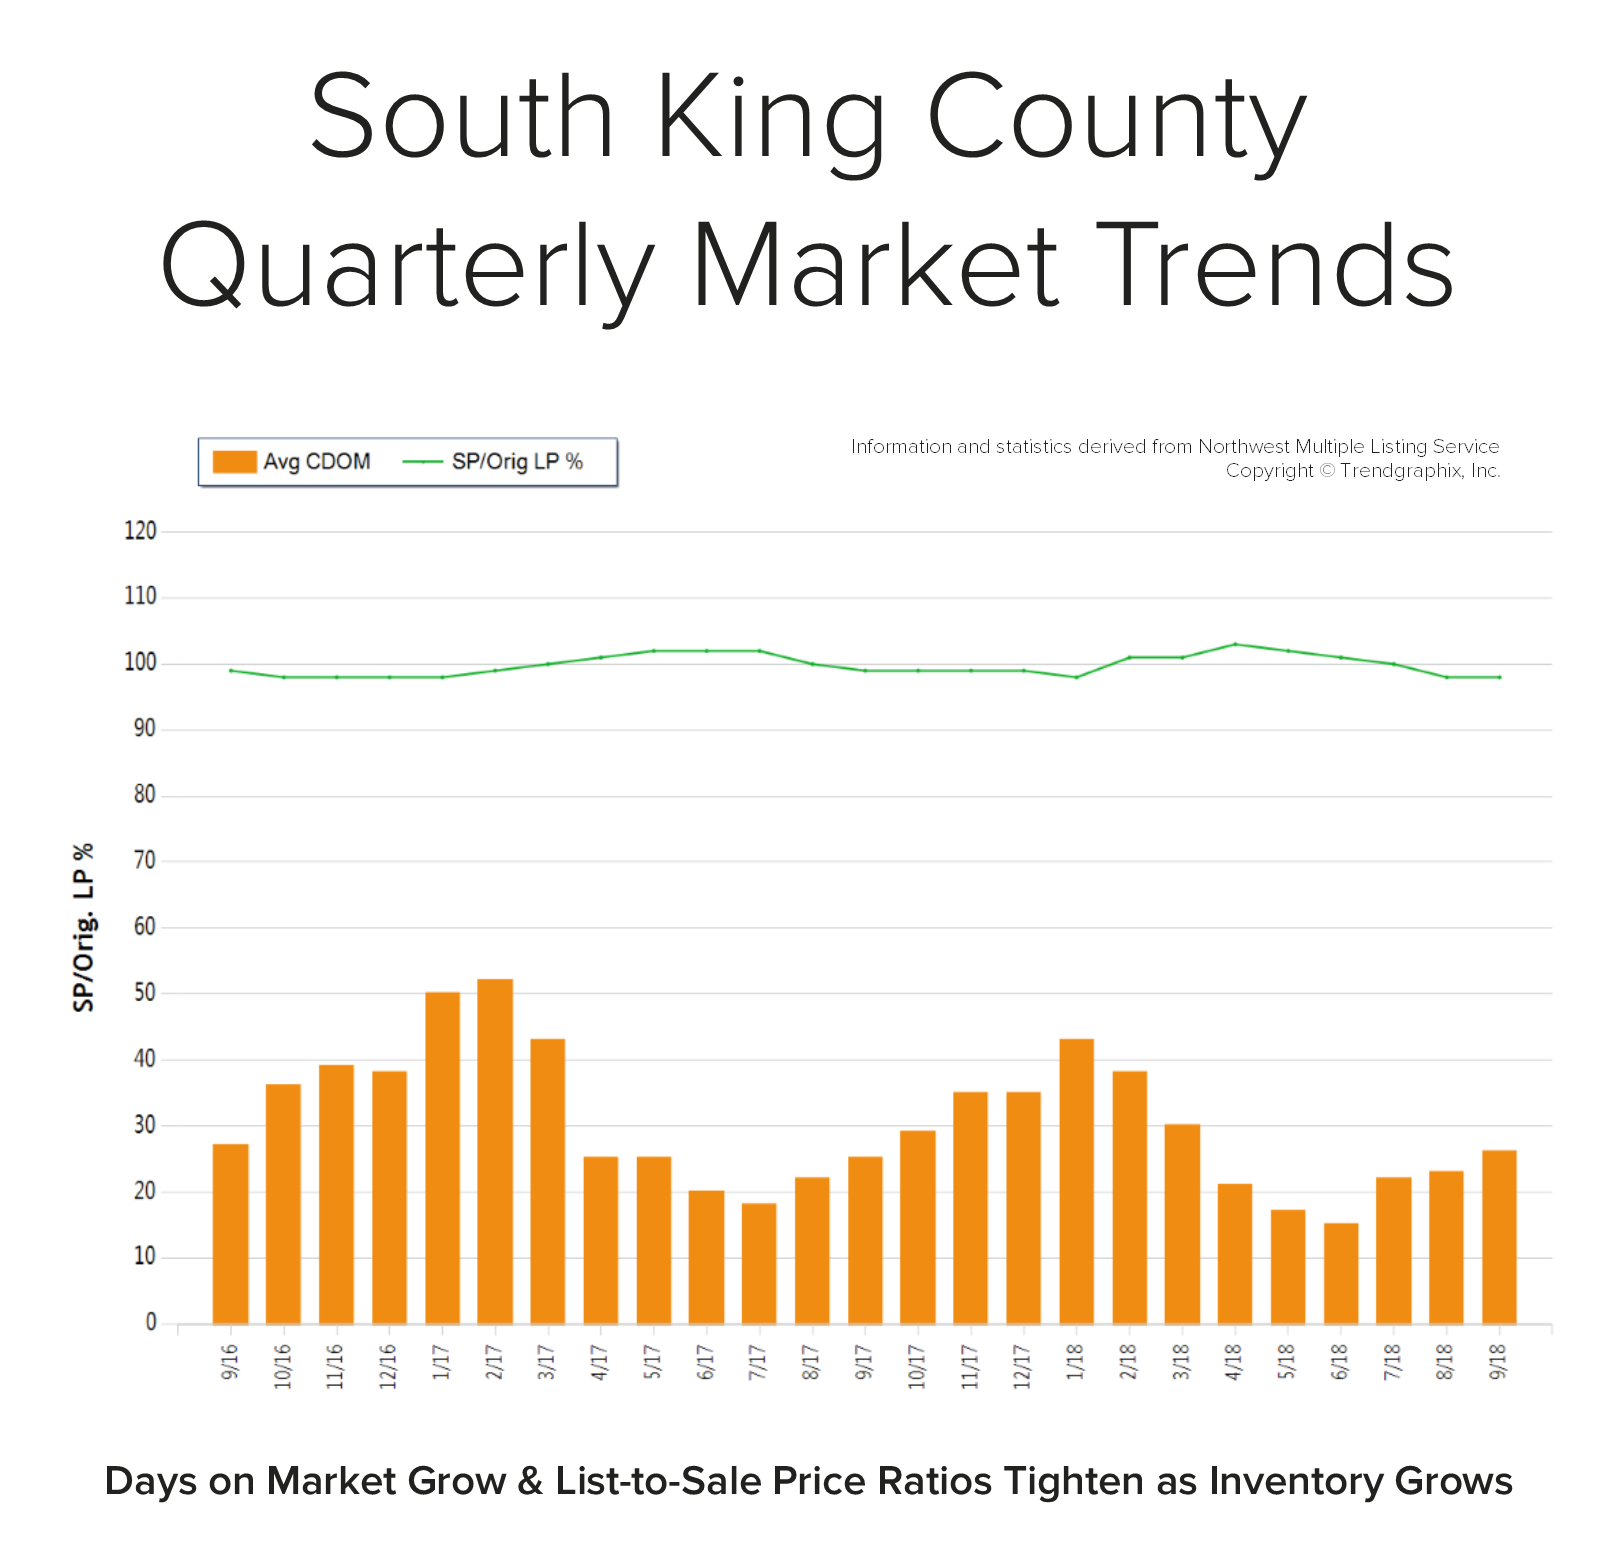
In September, the average days on market landed at 26 days and the original list-to-sale price ratio 98%. Since May, inventory growth has been noticeable, and has given buyers more options. This has led to more negotiations and fewer bidding wars, which is tempering month-over-month price growth to a more sustainable level. Back in April, the average days on market was 21 days and the original list-to-sale price ratio 103%; but months of inventory based on pending sales was 0.9 months, compared to 2.6 months currently. Year-over-year, prices are up 10%, still well above the historical norm of 3%-5% year-over-year gains—but note that the majority of this growth happened during the spring, due to constricted inventory levels.
Supply has increased, creating more options for buyers and helping to buffer affordability issues. Many sellers are deciding to make moves and cash in on the equity gained over the last six years. An average original list-to-sale price ratio of 98% is a positive return, yet illustrates a softening in the market after some very extreme times. With 10% price growth over the last 12-months in a seller’s favor, the increase in selection has led to more nimble moves from one house to another. Where sellers need to be careful is anticipating the month-over-month price growth we saw prior to the shift in inventory. Prospective buyers would be smart to take advantage of today’s historically low interest rates and the added inventory selection.
This is only a snapshot of the trends in south King County; please contact me if you would like further explanation of how the latest trends relate to you.
Eastside Quarterly Market Trends
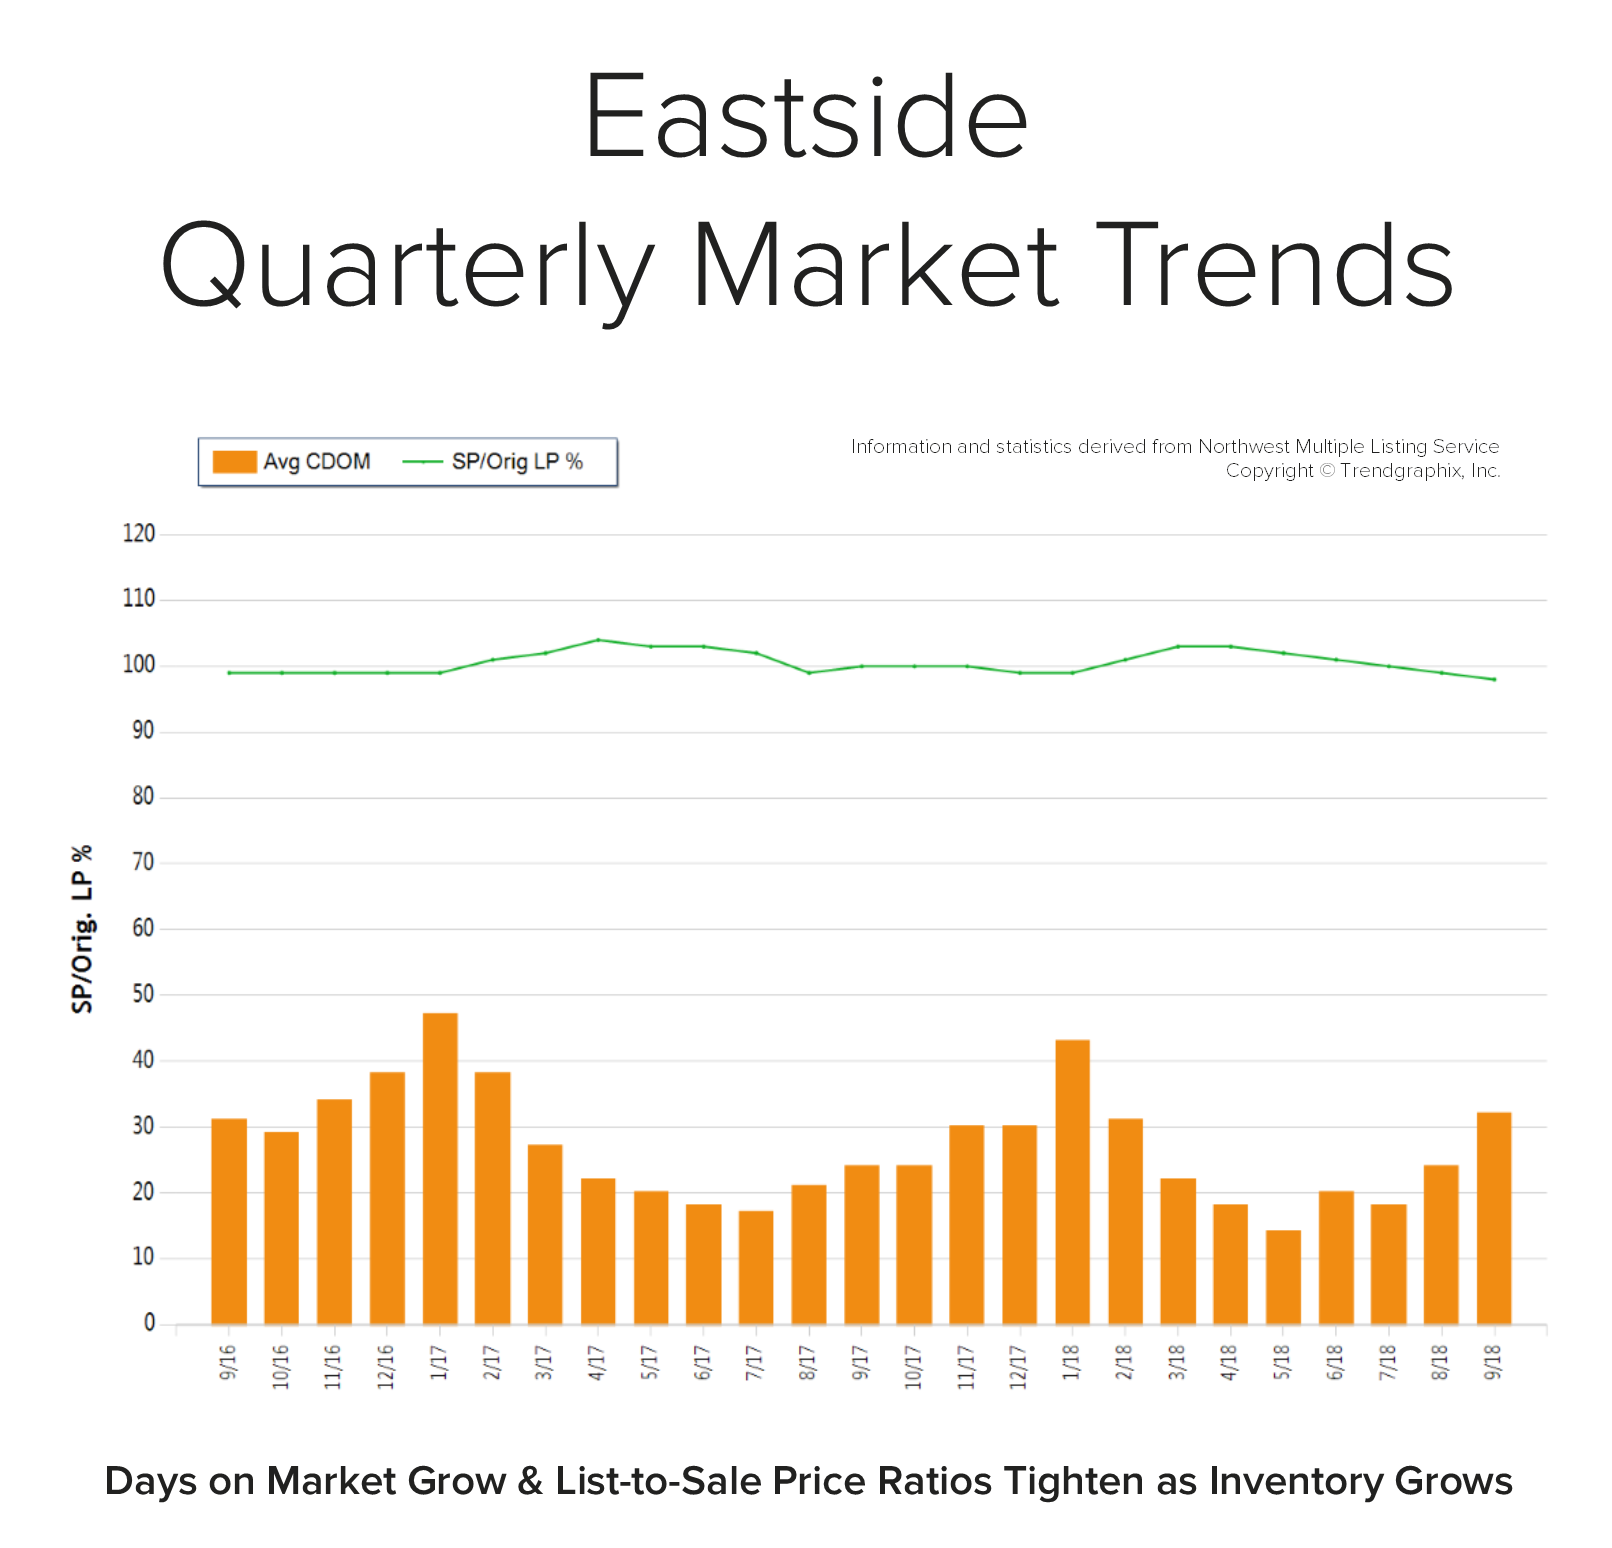
In September, the average days on market landed at 32 days and the original list-to-sale price ratio 98%. Since May, inventory growth has been noticeable, and has given buyers more options. This has led to more negotiations and fewer bidding wars, which is tempering month-over-month price growth to a more sustainable level. Back in April, the average days on market was 13 days and the original list-to-sale price ratio 103%; but months of inventory based on pending sales was 0.8 months, compared to 2.9 months currently. Year-over-year, prices are up 10%, still well above the historical norm of 3%-5% year-over-year gains—but note that the majority of this growth happened during the spring, due to constricted inventory levels.
Supply has increased, creating more options for buyers and helping to buffer affordability issues. Many sellers are deciding to make moves and cash in on the equity gained over the last six years. An average original list-to-sale price ratio of 98% is a positive return, yet illustrates a softening in the market after some very extreme times. With 10% price growth over the last 12-months in a seller’s favor, the increase in selection has led to more nimble moves from one house to another. Where sellers need to be careful is anticipating the month-over-month price growth we saw prior to the shift in inventory. Prospective buyers would be smart to take advantage of today’s historically low interest rates and the added inventory selection.
This is only a snapshot of the trends on the Eastside; please contact me if you would like further explanation of how the latest trends relate to you.
Seattle Metro Quarterly Market Trends
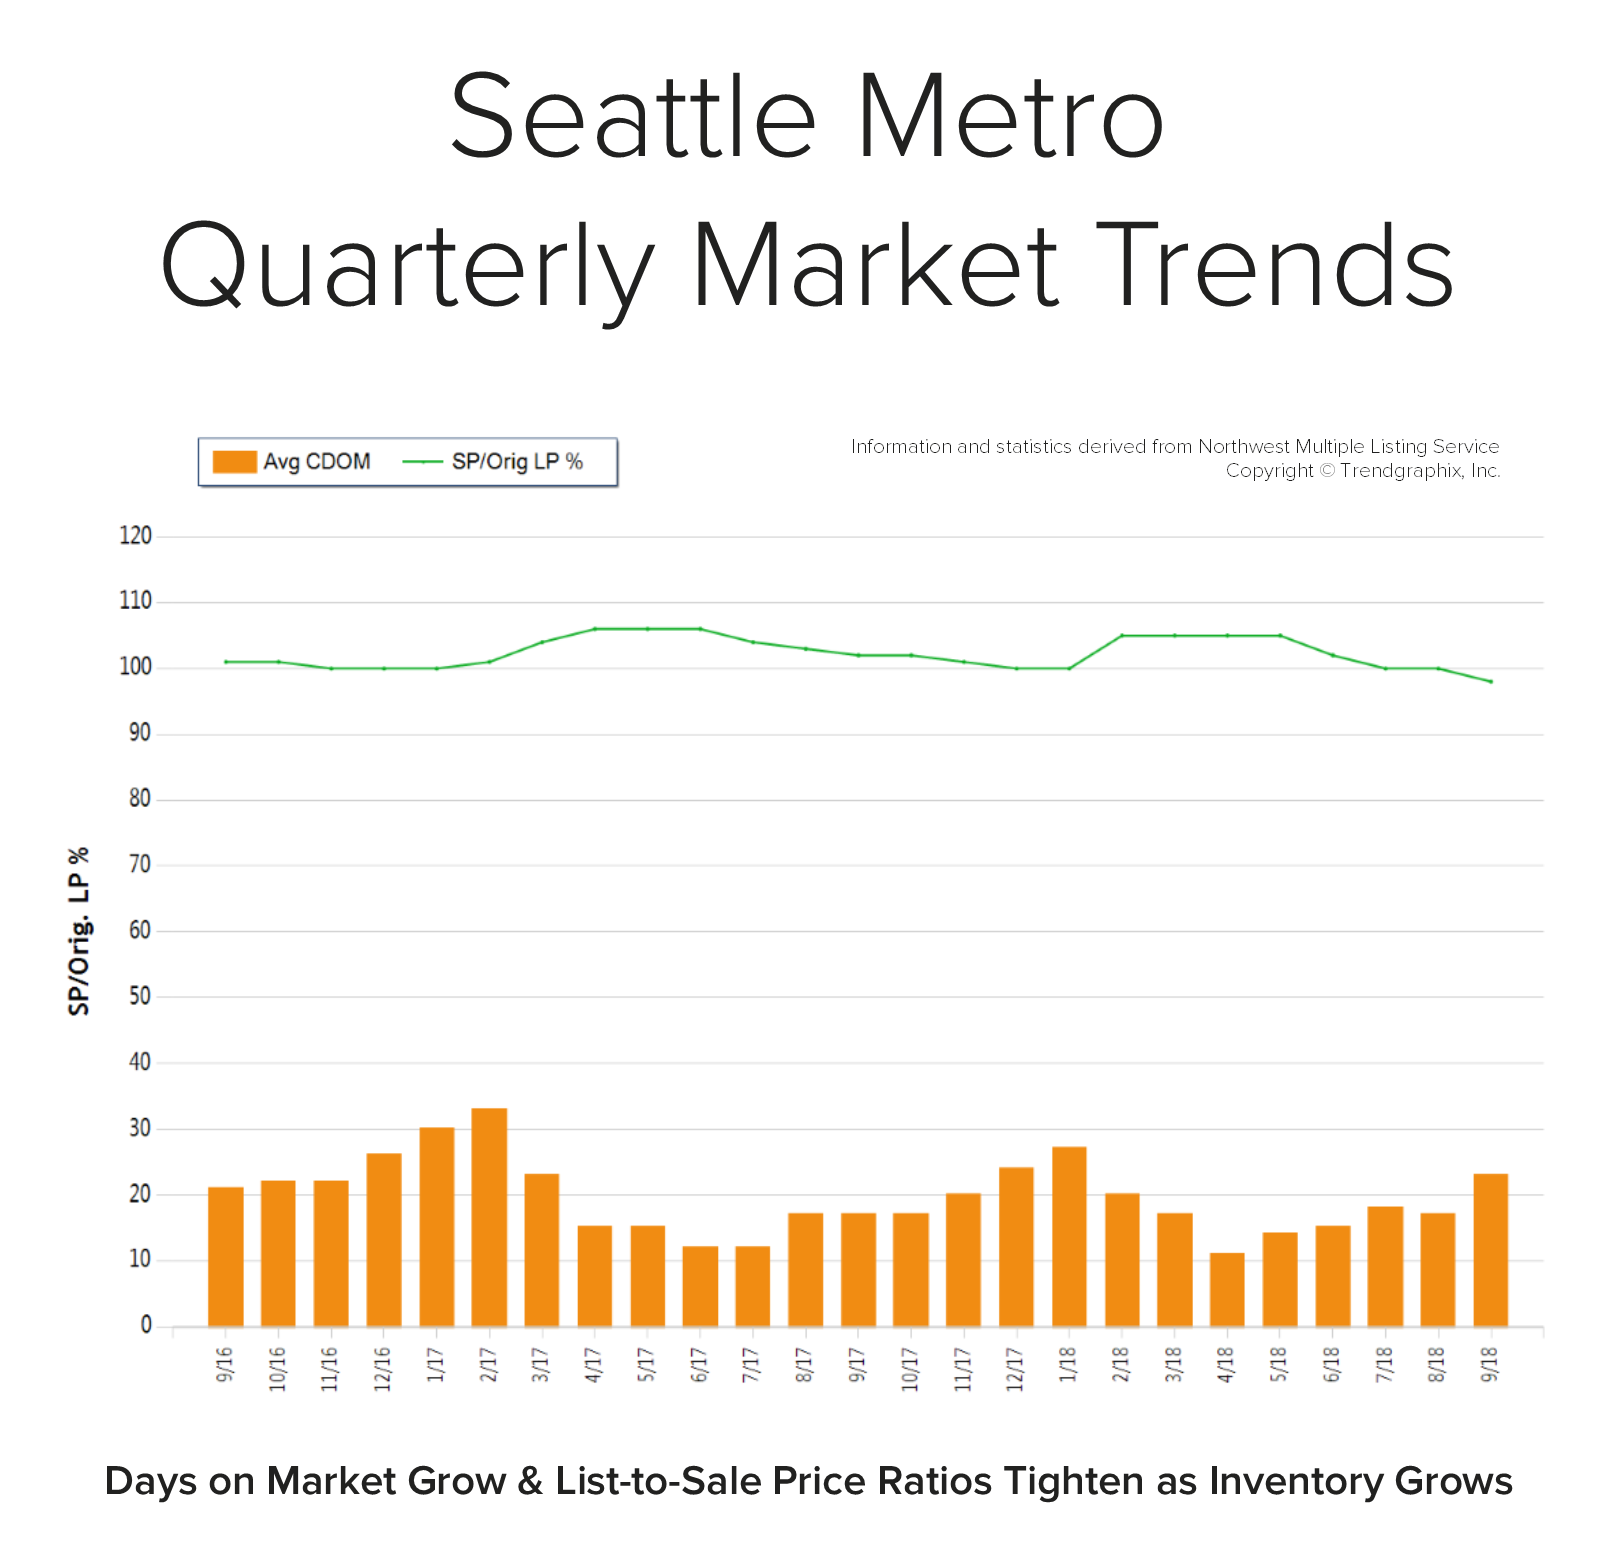
In September, the average days on market landed at 23 days and the original list-to-sale price ratio 98%. Since May, inventory growth has been noticeable, and has given buyers more options. This has led to more negotiations and fewer bidding wars, which is tempering month-over-month price growth to a more sustainable level. Back in April, the average days on market was 11 days and the original list-to-sale price ratio 105%; but months of inventory based on pending sales was 0.8 months, compared to 2.4 months currently. Year-over-year, prices are up 11%, still well above the historical norm of 3%-5% year-over-year gains—but note that the majority of this growth happened during the spring, due to constricted inventory levels.
Supply has increased, creating more options for buyers and helping to buffer affordability issues. Many sellers are deciding to make moves and cash in on the equity gained over the last six years. An average original list-to-sale price ratio of 98% is a positive return, yet illustrates a softening in the market after some very extreme times. With 10% price growth over the last 12-months in a seller’s favor, the increase in selection has led to more nimble moves from one house to another. Where sellers need to be careful is anticipating the month-over-month price growth we saw prior to the shift in inventory. Prospective buyers would be smart to take advantage of today’s historically low interest rates and the added inventory selection.
This is only a snapshot of the trends in the Seattle Metro area; please contact me if you would like further explanation of how the latest trends relate to you.
North King County Quarterly Market Trends
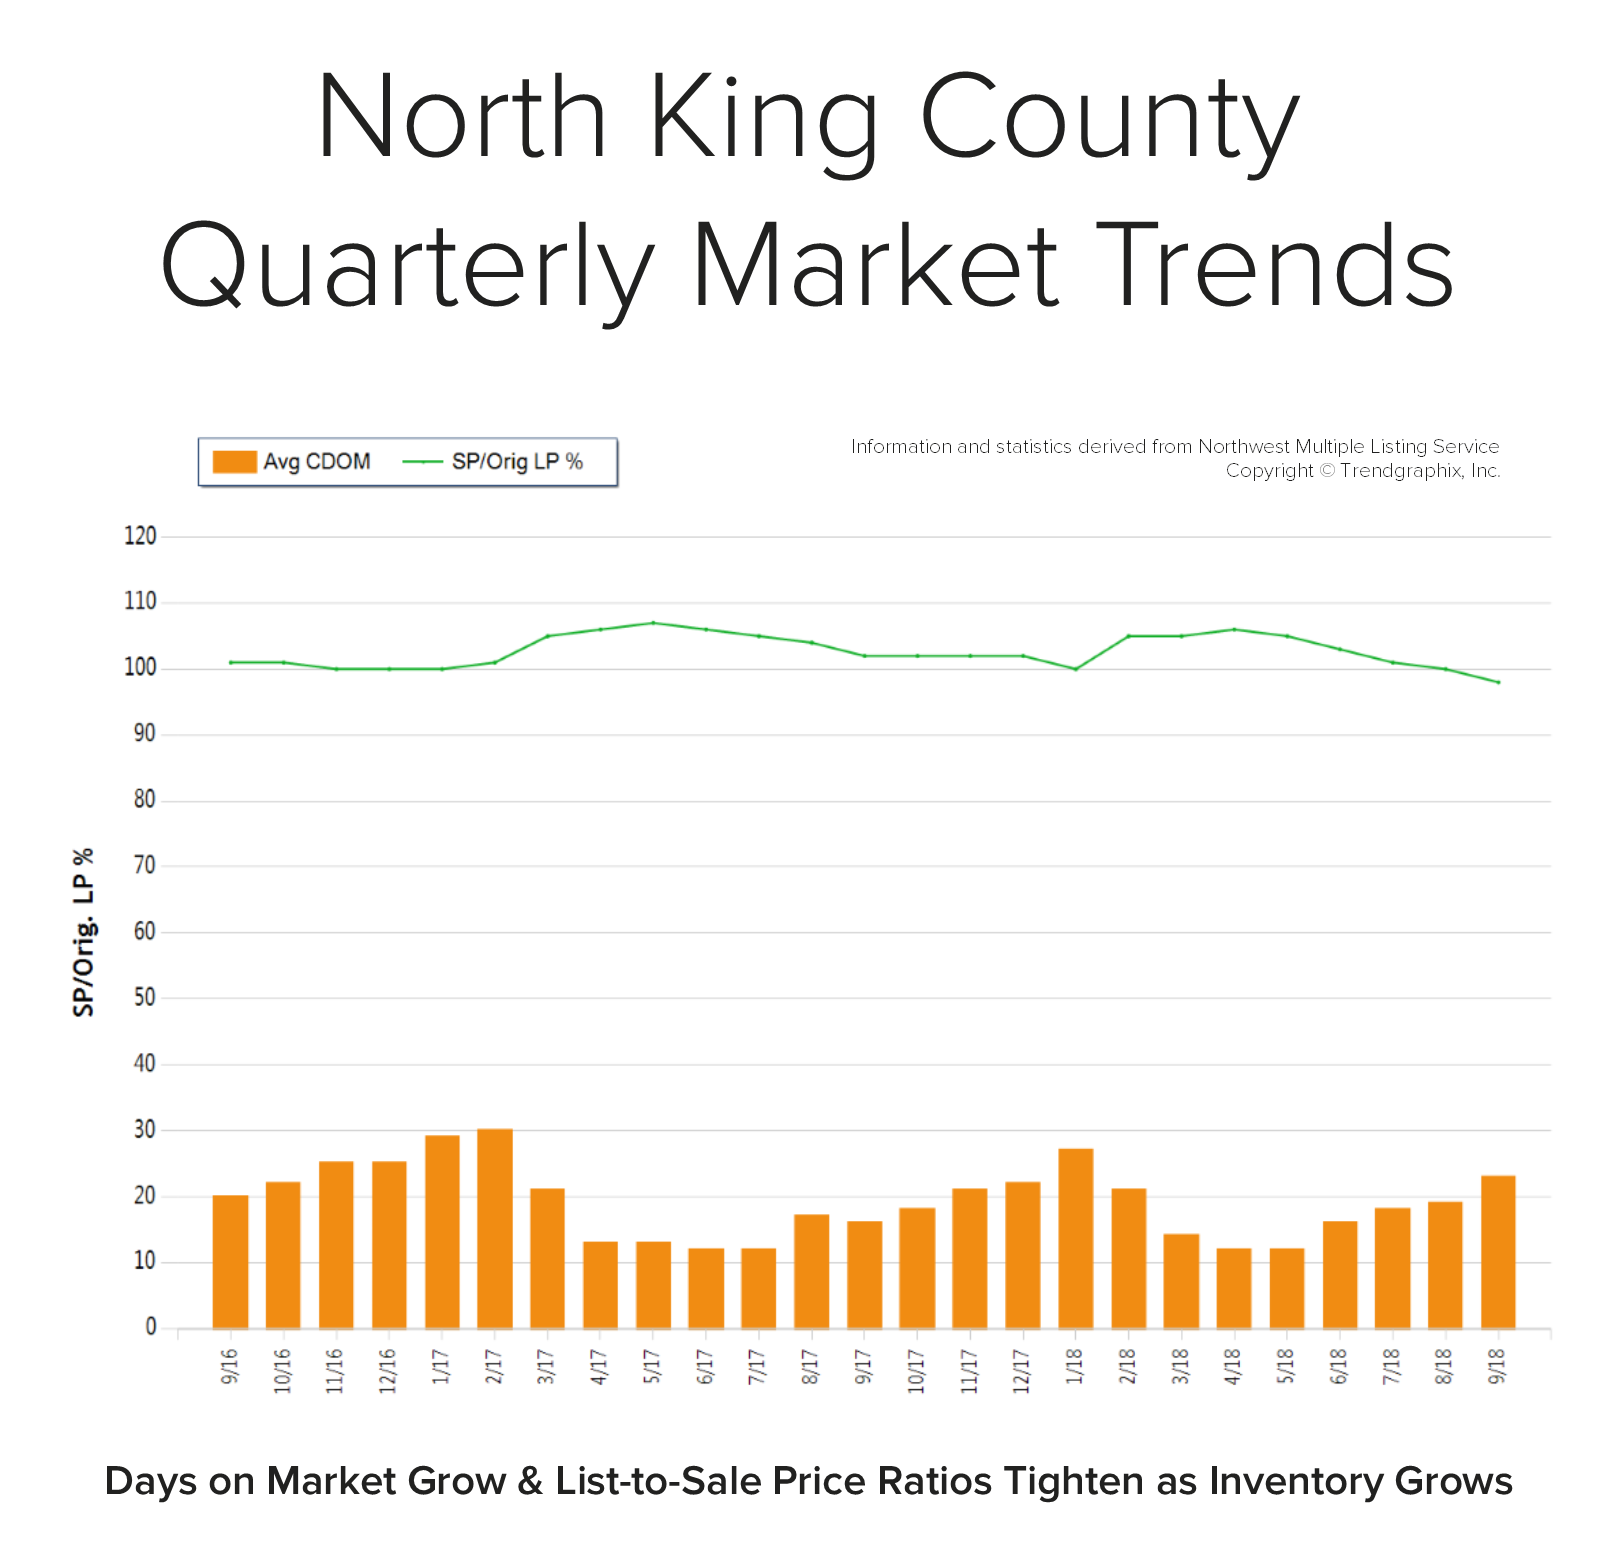
In September, the average days on market landed at 23 days and the original list-to-sale price ratio 98%. Since May, inventory growth has been noticeable, and has given buyers more options. This has led to more negotiations and fewer bidding wars, which is tempering month-over-month price growth to a more sustainable level. Back in April, the average days on market was 12 days and the original list-to-sale price ratio 106%; but months of inventory based on pending sales was 0.8 months, compared to 2.2 months currently. Year-over-year, prices are up 10%, still well above the historical norm of 3%-5% year-over-year gains—but note that the majority of this growth happened during the spring, due to constricted inventory levels.
Supply has increased, creating more options for buyers and helping to buffer affordability issues. Many sellers are deciding to make moves and cash in on the equity gained over the last six years. An average original list-to-sale price ratio of 98% is a positive return, yet illustrates a softening in the market after some very extreme times. With 10% price growth over the last 12-months in a seller’s favor, the increase in selection has led to more nimble moves from one house to another. Where sellers need to be careful is anticipating the month-over-month price growth we saw prior to the shift in inventory. Prospective buyers would be smart to take advantage of today’s historically low interest rates and the added inventory selection.
This is only a snapshot of the trends in north King County; please contact me if you would like further explanation of how the latest trends relate to you.
South Snohomish County Quarterly Market Trends
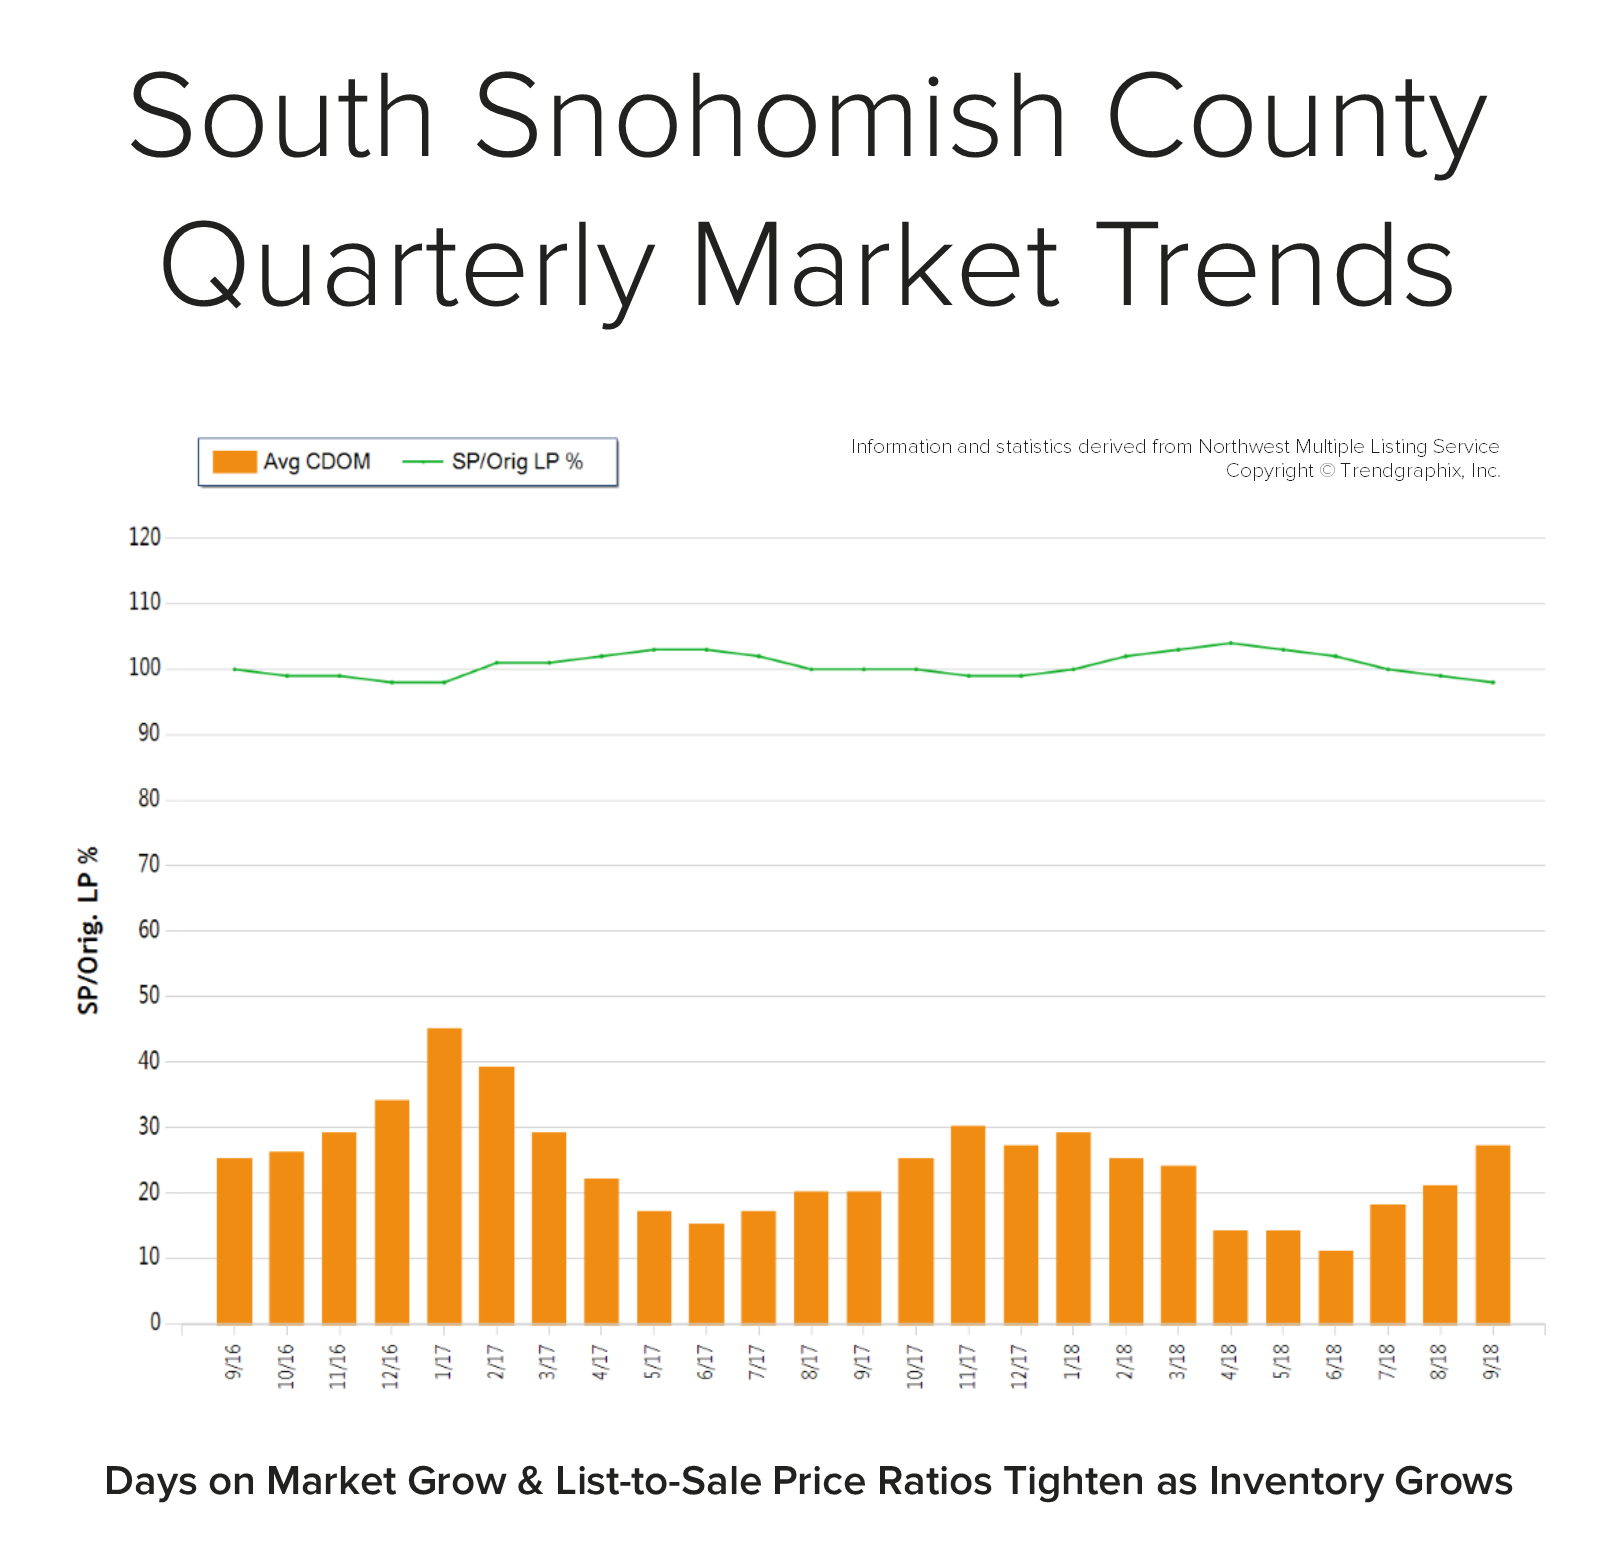
In September, the average days on market landed at 27 days and the original list-to-sale price ratio 98%. Since May, inventory growth has been noticeable, and has given buyers more options. This has led to more negotiations and fewer bidding wars, which is tempering month-over-month price growth to a more sustainable level. Back in April, the average days on market was 14 days and the original list-to-sale price ratio 104%; but months of inventory based on pending sales was 0.8 months, compared to 2.5 months currently. Year-over-year, prices are up 11%, still well above the historical norm of 3%-5% year-over-year gains—but note that the majority of this growth happened during the spring, due to constricted inventory levels.
Supply has increased, creating more options for buyers and helping to buffer affordability issues. Many sellers are deciding to make moves and cash in on the equity gained over the last six years. An average original list-to-sale price ratio of 98% is a positive return, yet illustrates a softening in the market after some very extreme times. With 11% price growth over the last 12-months in a seller’s favor, the increase in selection has led to more nimble moves from one house to another. Where sellers need to be careful is anticipating the month-over-month price growth we saw prior to the shift in inventory. Prospective buyers would be smart to take advantage of today’s historically low interest rates and the added inventory selection.
This is only a snapshot of the trends in south Snohomish County; please contact me if you would like further explanation of how the latest trends relate to you.

